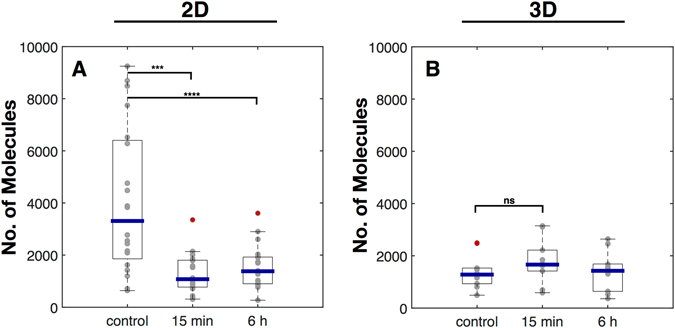
Figure 6.

Effects of IR on pFAK of 2D and 3D cultured MEF cells. Box plots of the number of molecules per 4 × 4 µm ROI of cells cultured in 2D (A) and 3D (B). Cells were irradiated with 6 Gy and were fixed 15 min and 6 h after irradiation. For 2D cells N = 2 and n = 20, for 3D cells N = 2 and n = 10. Statistical analysis was performed with an ordinary one-way ANOVA. ***p ≤ 0.001 and ****p ≤ 0.0001. NS, not significantly different. If not further noted no significance was detected.
