
Figure 7.
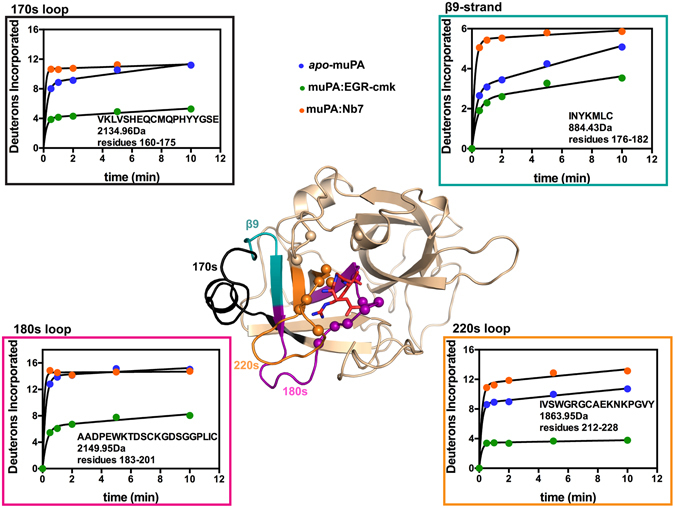
Backbone dynamics of muPA. Displayed is the catalytic protease domain of muPA from the muPA:Nb7:EGR-cmk structure (Nb7 is removed for clarity) with EGR-cmk shown as sticks (red). Residues in muPA within contacts distance of EGR-cmk (<4 Å) are represented as spheres. Peptides included in the HDXMS analysis and their corresponding deuterium uptake plots are highlighted on the structure and boxed in different colors: 170s loop (black); β9-strand (teal); 180s loop (magenta); 220s loop (orange). The deuterium uptake plots show the 4 peptides from apo-muPA (blue), EGR-cmk-bound muPA (green) and Nb7-bound muPA (orange) respectively. The amino acid sequence and molecular masses are indicated for each peptide. The Y-axis is scaled to show the maximum uptake for each individual peptide. Error bars, s.d. (n = 3 independent measurements).