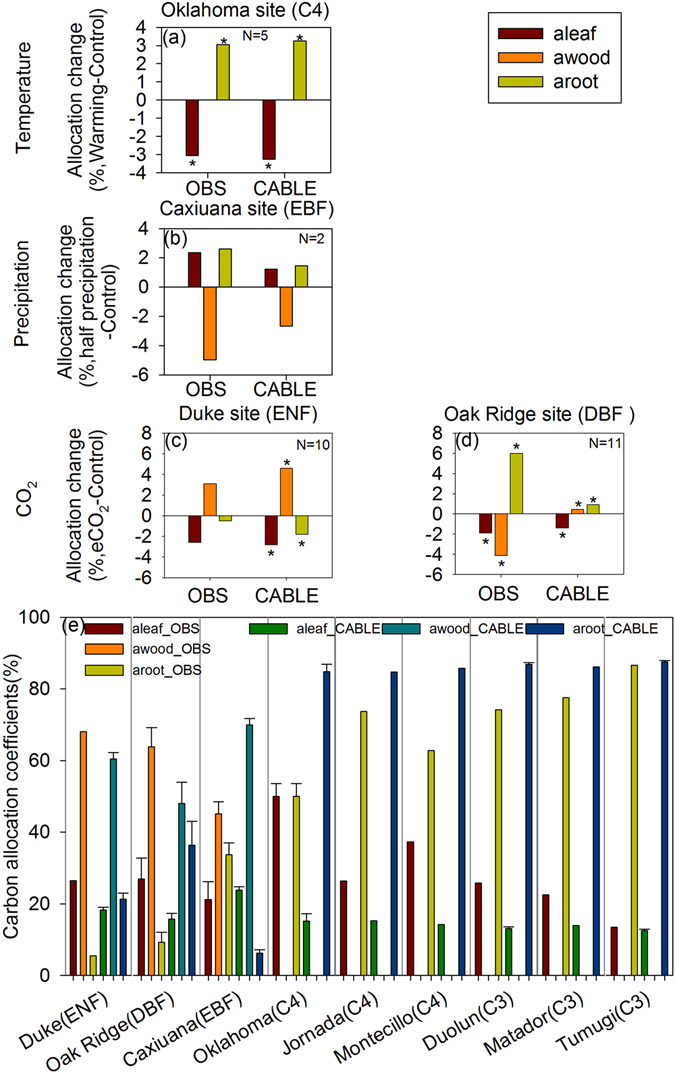
Figure 1.

Comparison of carbon allocation coefficients to leaves (aleaf), woody tissues (awood), and roots (aroot) between observations (OBS) and CABLE model with the resource limiation allocation scheme at warming (a), precipitation reduction (b) and elevated atmospheric CO2 (eCO2, c,d) sites and and natural sites (e). ENF: evergreen needleleaf forest; EBF: evergreen broadleaf forest; DBF: deciduous broadleaf forest; C3: C3 grass; C4: C4 grass. *Significant change (p < 0.05).
