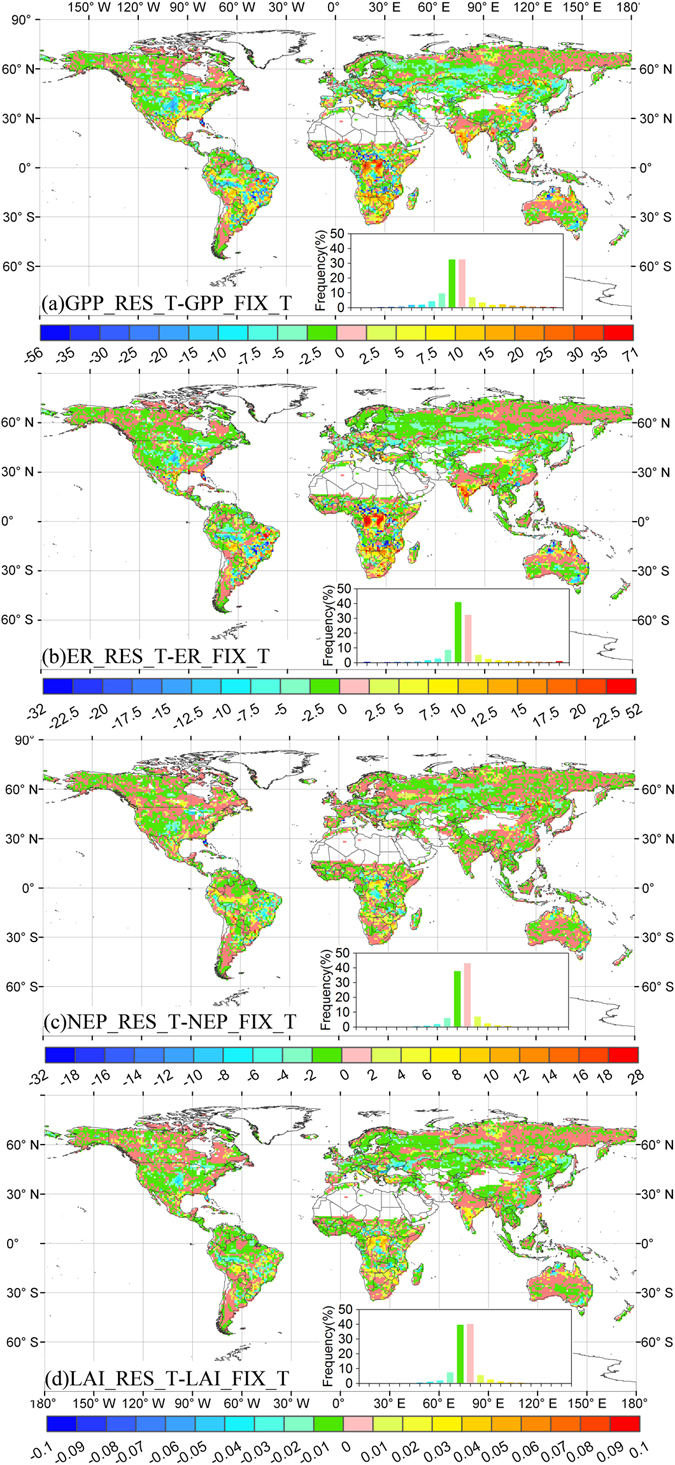
Figure 5.

Differences in the trends in gross primary production (GPP, g C m−2 yr−2), ecosystem respiration (ER, g C m−2 yr−2), net ecosystem productivity (NEP, g C m−2 yr−2), and leaf area index (LAI) between CABLE using the resource limitation (RES_T) and fixed coefficient (FIX_T) carbon allocation models during 1979–2014. The insets show the frequency distributions of the corresponding trends. The maps were created by the ArcMap 9.3.
