
Figure 1.
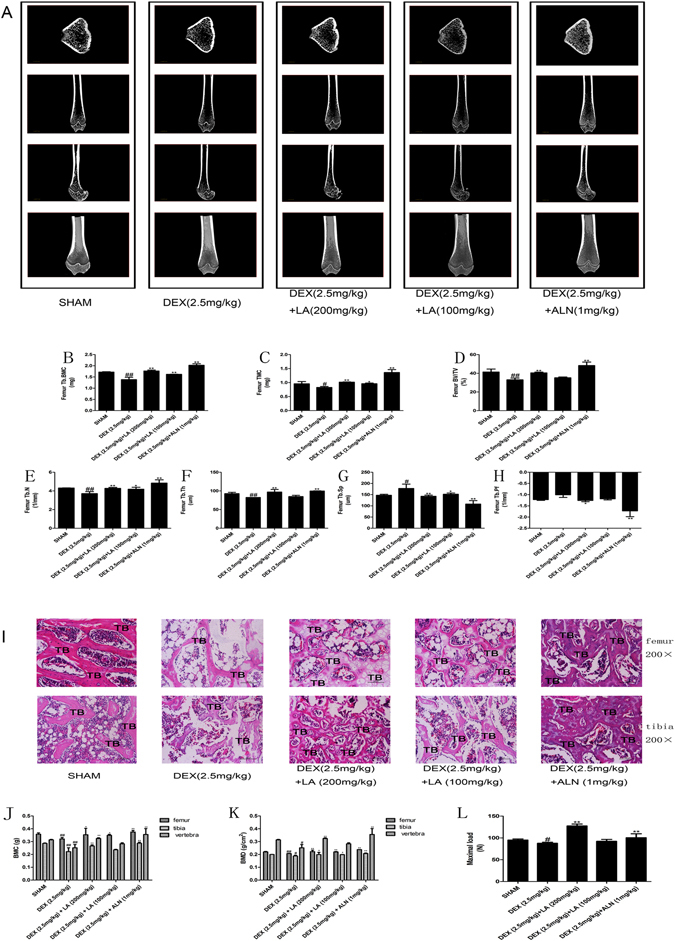
The representative micro-CT images of the femurs in each group (A) (n = 3 for each group). Analysis of the distal femoral trabecular bone parameters by micro-CT. Tb.BMC (B), TMC (C), BV/TV (D), Tb.N. (E), Tb.Th. (F), Tb.sp. (G), Tb.pf. (H) Data were the means ± SD (n = 3 for each group). # P < 0.05 and ## P < 0.01, vs. the SHAM group. *P < 0.05 and **P < 0.01, vs. the DEX group. The static histomorphometric analysis of femur and tibia by hematoxylin & eosin staining (I) (n = 3 for each group). All images of H&E staining were at ×200 magnifications. Bars: 100 μm. TB: trabecular. BMC and BMD of femur, tibia and vertebra (n = 6 for each group). BMC were determined in each of the five groups (J). BMD was calculated on the basis of BMC (K). Evaluation of biomechanical properties on femur by using a three point blending test (L) (n = 3 for each group), It was calculated from load-displacement curves. # P < 0.05 and ## P < 0.01, vs. the SHAM group. *P < 0.05 and **P < 0.01, vs. the DEX group.