
Figure 3.
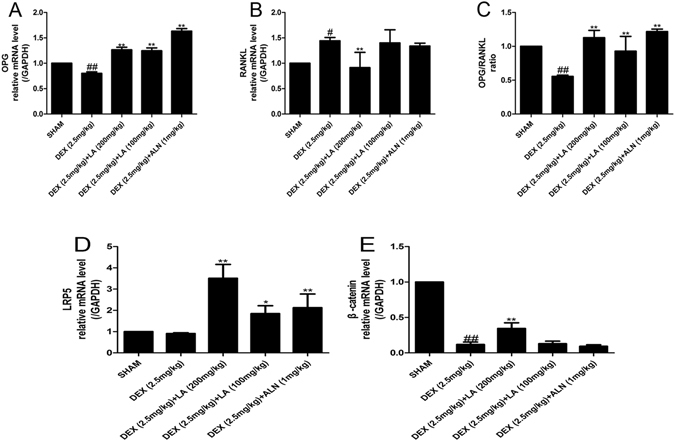
The mRNA expression levels of OPG and RANKL on the femur. The mRNA expression levels were measured by qRT-PCR for OPG (A), RANKL (B). OPG/RANKL ratio (C). Data were the means ± SD (n = 6 for each group). # P < 0.05 and ## P < 0.01, vs. the SHAM group. *P < 0.05 and **P < 0.01, vs. the DEX group. The mRNA expression levels of the LRP5/beta-catenin pathway on femur. The mRNA expression levels were measured by qRT-PCR for LRP5 (D), beta-catenin (E). Data were the means ± SD (n = 6 for each group). # P < 0.05 and ## P < 0.01, vs. the SHAM group. *P < 0.05 and **P < 0.01, vs. the DEX group.