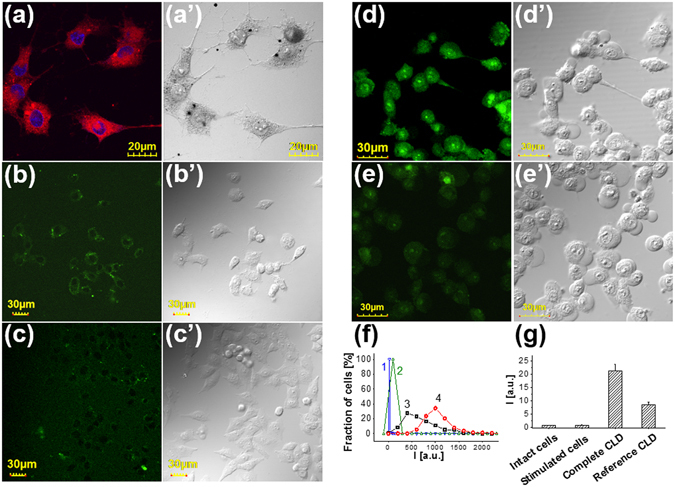
Figure 7.

Intracellular localization of TMHP and oxidized SOSG in the cells treated with CLD. (a) LCSM image of the cells treated with complete CLD in the serum-free culture medium for 1 h at 37 °C and fixed with 4% formaldehyde in PBS. Nuclei were stained with 0.3 µM DAPI. The left panel shows merged blue and red channels, the right panel shows differential interference contrast image. (b–g) Evidence for singlet oxygen generation due to PO-CL reaction in the cells. Confocal images of (b) intact cells, (c) the cells in the oxidative stress state, (d) similarly prepared cells treated with the complete and (e) reference CLD without TMHP. All samples were stained with 10 mM of SOSG (f) Distributions of the cells by the intensity of their fluorescence calculated from the analysis of at least 10 different images containing about 300 cells. 1 – intact cells, 2 – the cells under oxidative stress conditions, 3 – the cells prepared as in the sample (2) and treated with the complete CLD or 4 – with the reference dispersion without TMHP. (g) Measurement of SOSG endoperoxide fluorescence in the similarly prepared samples using plate fluorometer. Each sample contained about 0.2 millions of cells.
