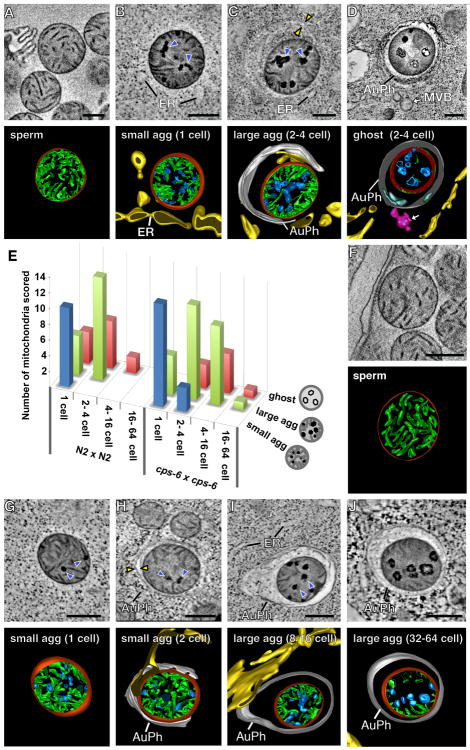
Fig. 1. Loss of cps-6 delays internal breakdown of paternal mitochondria following fertilization.
(A to D, F to J) Tomographic slice images and corresponding 3D models of a mitochondrion in an N2 (A) or cps-6(tm3222) (F) spermatozoon or a paternal mitochondrion in an N2 embryo (B to D) or a cps-6(tm3222) embryo (G to J) at the indicated stages. 3D models of autophagosomes (AuPh) and endoplasmic reticulum (ER) are shown. Mitochondrial membranes, cristae, and aggregates are colored in red, green, and blue, respectively. Dark aggregates and autophagosome membranes are indicated with blue and yellow arrowheads, respectively. Scale bars indicate 300 nm. (E) A histogram showing three classes of paternal mitochondria in different stage embryos from the indicated N2 cross (n=45) or cps-6(tm3222) cross (n=56).

