Figure 2.

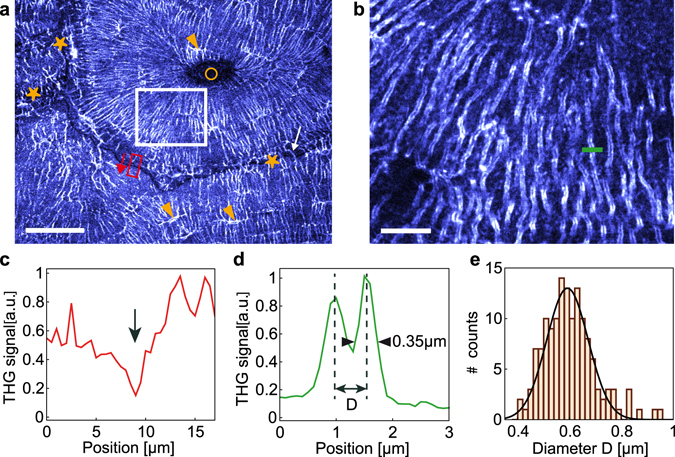
THG reveals interfaces in cortical bone. (a) THG image of a transverse section of a bovine femur at a depth of 10 µm within the sample, revealing the LCN (lacunae indicated with arrowheads) and the cement line of the osteons (stars). Circle, Haversian channel. The white arrow shows a canalicule crossing the cement line. Scale bar, 50 µm. (b) Zoom on the white box shown in (a), revealing the two interfaces of the canaliculi. Scale bar, 10 µm. (c) Profile along the red box in (a), illustrating the reduced signal at the cement line (arrow). (d) Profile across a canalicule along the green line in b providing an estimate for the canalicule diameter D and for the lateral resolution. (e) Distribution of canalicule diameters D estimated from THG images in the volume shown in Supplementary Movie 1 including image (b).
