
Figure 3.
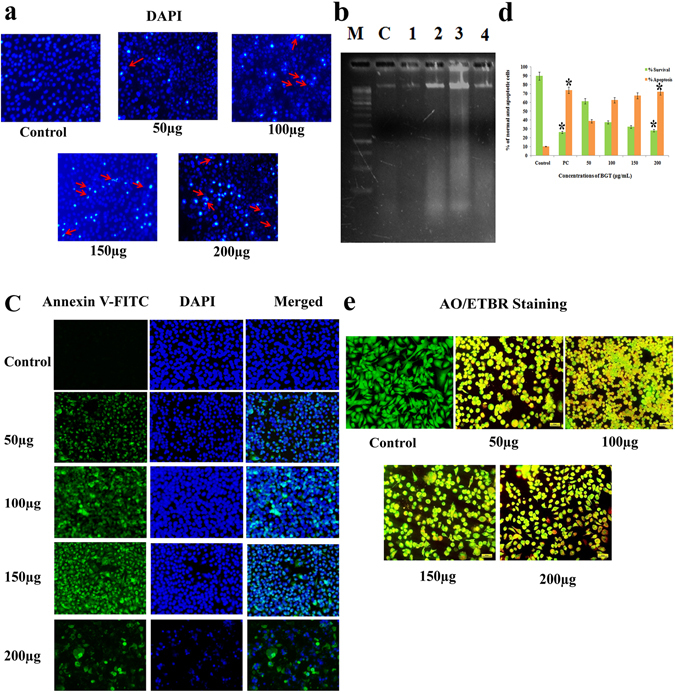
BGT induced apoptosis in A549 cells. (a) A549 cells treated with indicated concentration of BGT for 48 h, stained by DAPI and observed in fluorescence microscopy. The arrow heads indicates chromatin condensation with changes of nuclear morphology and DNA fragmentations. (b) DNA fragmentation of BGT treated A549 cells. M-1kb ladder DNA, C-Control and Lane 1–4 is different concentration of BGT (50–200 μg/mL) treated A549 cells. (c) Fluorescence microscopy images of Annexin-V/FITC and DAPI stained BGT treated and control cells. (d) Quantitative measurement of apoptotic cells after BGT treatment with the indicated concentration at 48 h. (e) Fluorescence microscopy images of AO/ETBR stained BGT treated A549 cells after 48 h. All the images were acquired in 200X magnification. *p < 0.01 denote the statistical significance between the control and treated groups.