
Figure 2.
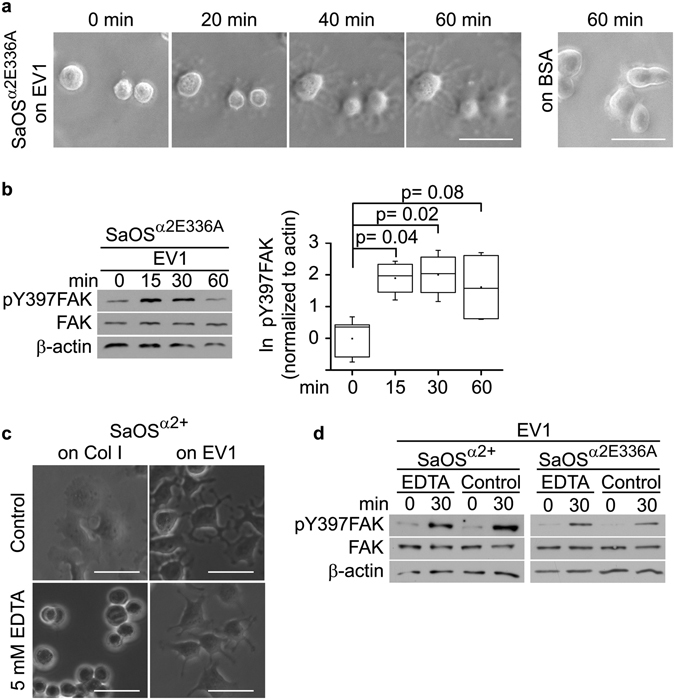
FAK is activated through α2 integrins harboring the loss-of-function mutation E366A in the α2 subunit, and in the presence of EDTA. (a) SaOS cells with the loss-of-function mutation E336A in the α2 subunit (SaOSα 2E336A) on EV1-coated surface. Photographed through a phase contrast microscope after 0, 20, 40, and 60 min. Scale bar 50 μm. (b) Western blot analysis of pY397FAK in SaOSα 2E336A cells plated on EV1. Typical experiment on the left, and on the right, a visualization of the results from four independent experiments presented in box blot as natural logarithm of pY397FAK band intensity normalized to β-actin. Whiskers present minimum and maximum of all of the data. Non-parametric Mann-Whitney U test was used to determine statistical significance. (c) Phase contrast microscopy images of SaOSα 2+ cells treated with integrin inactivating EDTA (5 mM) after spreading for 60 min on an immobilized layer of EV1 or collagen I. Scale bar 50 μm. (d) Western blot analysis of pY397FAK in SaOSα 2+ and SaOSα 2E336A cells treated with 5 mM EDTA and plated on an immobilized layer of EV1.