
Figure 3.
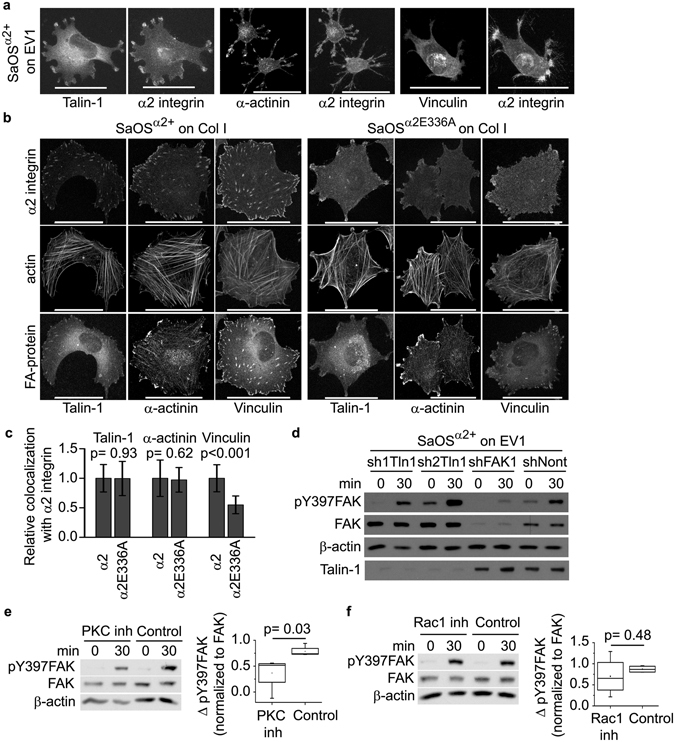
Protein interaction with nonactivated α2 integrins. (a) Confocal microscopy images of SaOSα 2+ cells plated on EV1 coated cell culture plate showing talin-1, α-actinin, vinculin and α2-integrin localization. Scale bar 50 μm. (b) Confocal microscopy images of SaOSα 2+ and SaOSα 2E336A cells plated on collagen I showing talin-1, α-actinin, vinculin and α2-integrin localization. Scale bar 50 μm. (c) Measurement of the localization of talin 1, α-actinin and vinculin to α2 integrin positive areas in confocal microscopy images similar to images shown in B (10–20 images from three independent experiments, analysed with BioImageXD). Statistical significance was calculated with unpaired Student’s t-test. (d) Western blotting of Y397 phosphorylation of FAK in talin 1 silenced SaOSα 2+ cells spreading on an immobilised layer of EV1. Talin 1 was silenced with two different shRNAs, and as a control, one nontarget shRNA and one shRNA able to silence FAK were used. (e,f) Western blotting of Y397 phosphorylation of FAK in SaOSα 2+ cells spreading on EV1 after treatment with PKC inhibitor safingol (e; 10 μM, 30 min, n = 4) or Rac inhibitor NSC23766 (f; 100 μM, 1 h, n = 4). Data are presented as box blot where whiskers present minimum and maximum values. The p value from paired one-tailed Student’s t-test is shown.