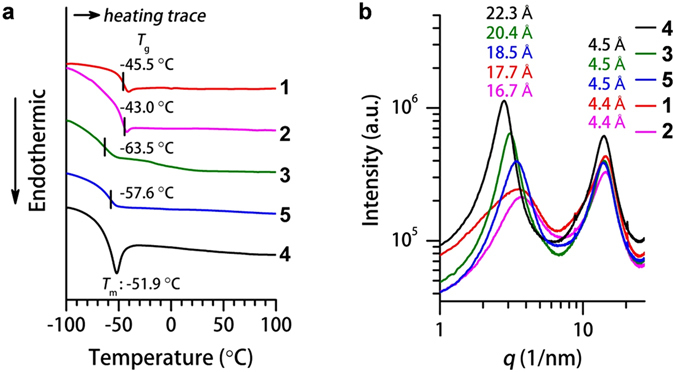
Figure 2.

Phase properties and structural analysis of 1–5. (a) Differential scanning calorimetry thermograms of 1 (red), 2 (pink), 3 (green), 4 (black) and 5 (blue) in the second heating trace at a scan rate of 10 °C min−1 showing the glass-to-isotropic transition (T g) for 1, 2, 3 and 5, and melting point (T m) for 4. (b) Small and wide-angle X-ray scattering profiles of 1 (red), 2 (pink), 3 (green), 4 (black) and 5 (blue) at 25 °C.
