
Figure 1.
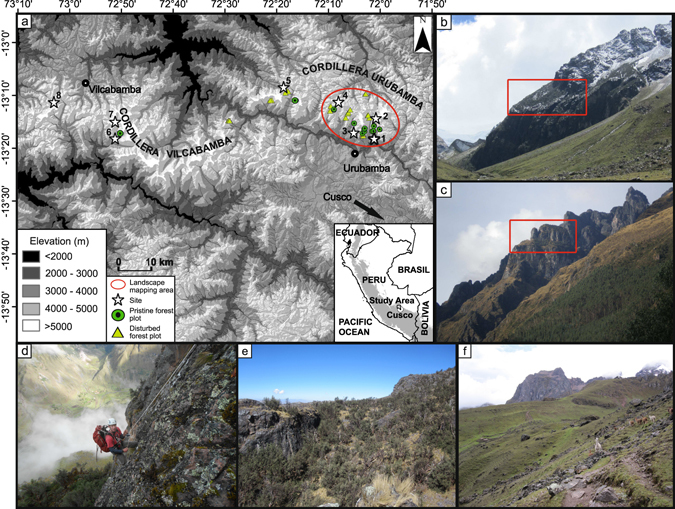
Map and impression of the study sites. (a) Map of the study area showing the eight study sites (denoted by numbered stars), the locations of inaccessible and accessible forest plots (denoted by green-filled circles and yellow-filled triangles, respectively), and the area used for landscape mapping of woodland and grassland in accessible and inaccessible areas (denoted by a red oval). (b,c) Examples of study sites with the inaccessible ledges studied circled in red with the accessible human-impacted grasslands in the foreground. (d) first author abseiling into an inaccessible site. (e) Example of an inaccessible site with open forest intermixed with grassland. (f) Example of an accessible site. Photographs (b,c,e,f) taken by S.P. Sylvester; (d) taken by F. Heitkamp. ASTER Global Digital Elevation Model (GDEM) v2 data raster map presented in (a) is a product of NASA and METI and is distributed by NASA LP DAAC (https://lpdaac.usgs.gov/). Map generated using ArcGIS v.10.1 (http://www.esri.com/).