
Figure 2.
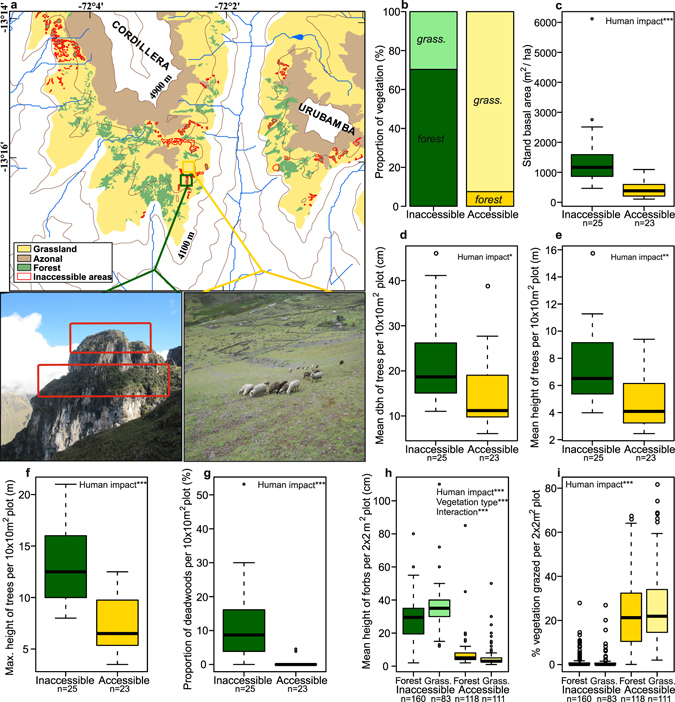
Comparisons of inaccessible and accessible vegetation structure. (a,b) Example of the landscape mapping approach showing an inaccessible and nearby accessible site (a) and the total proportion of forest and grassland of zonal vegetation in the Cordillera Urubamba between 4200 m and 4900 m calculated from this (b). (c–g) Comparisons of forest structure i.e. stand basal area (c), mean dbh (d), and mean (e) and maximum height (f) of trees, and proportion of deadwoods (g), per 10 × 10 m2 forest plot in accessible and inaccessible Polylepis forests. (h,i) Comparison of mean height of herbaceous vegetation (e) and vegetation cover grazed (i) per 2 × 2 m2 plot in inaccessible and accessible forest and grassland. Significant relationships between the structural properties and fixed effects (human impact; vegetation type) found upon analysis using generalized linear mixed models (GLMM’s) are noted within the figures (***p < 0.001, **p < 0.01, *p < 0.05; Tables S13 and S14). Photographs by S.P. Sylvester. Map generated using ArcGIS v.10.1 (http://www.esri.com/).