
Figure 3.
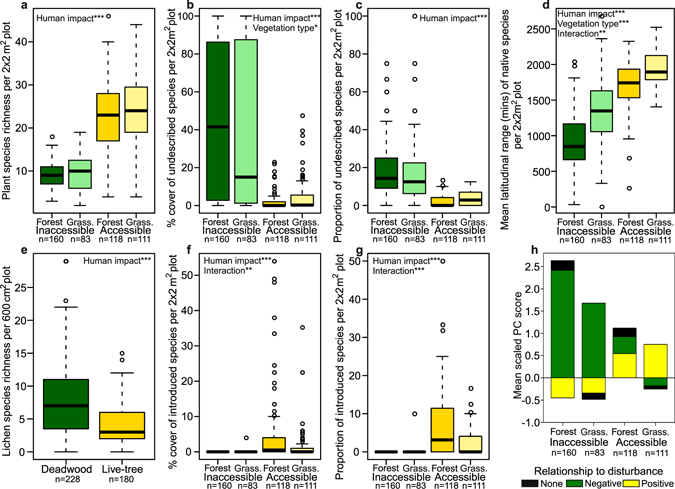
Plant diversity, composition and traits in inaccessible and accessible forest and grassland. (a–h) Comparisons of species richness of vascular plants per plot (a), cover and proportion of undescribed (b,c) and introduced (f,g) plant species per plot, and average latitudinal amplitude of native plant species per plot excluding introduced species (d). Epiphytic lichen species richness (e) is compared between deadwood substrate, generally only found in inaccessible forests (Fig. 2g), and live trees. To compare disturbance-related plant traits (h), the cumulative means of scaled principal components, referring to positive and negative disturbance related plant trait syndromes, averaged over all species per 2 × 2 m2 plot, are compared (Fig. S3 and Table S6). Significant relationships between the structural properties and fixed effects, found upon analysis using GLMM’s, are noted within the plots (***p < 0.001, **p < 0.01, *p < 0.05; Tables S15 and S16).