
Figure 5.
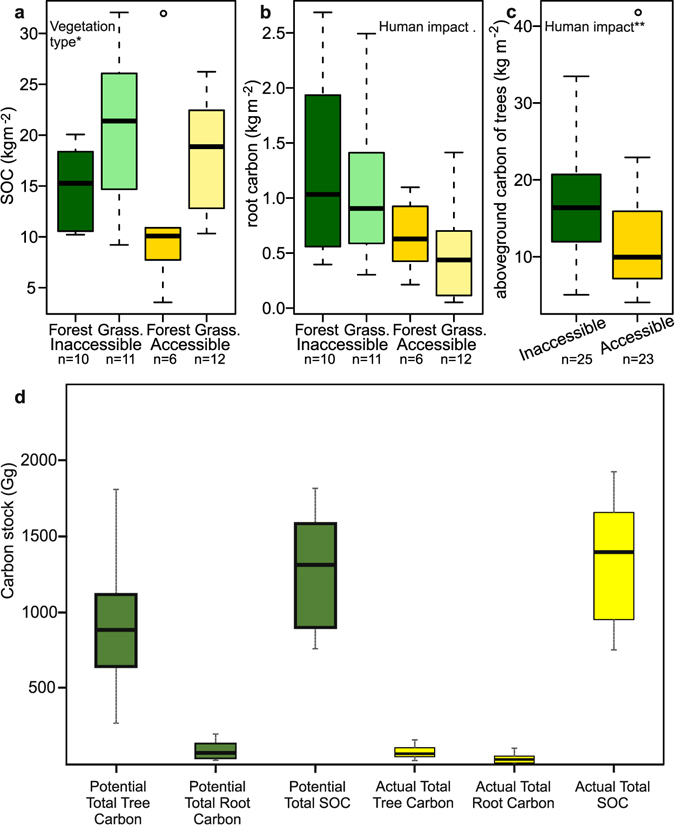
Comparisons of carbon properties between inaccessible and accessible forest and grassland (a–c) and comparison of potential and actual landscape carbon stocks (d). (a–c) Comparisons of carbon contents in Soil Organic Carbon (SOC) (a), root biomass (b) and aboveground biomass of trees (c). Significant relationships between the structural properties and fixed effects, found upon analysis using GLMM’s, are noted within the figures (**p < 0.01, *p < 0.05, p < 0.1; Table S18). (d) Estimated values of the potential (green) and current (yellow) carbon stocks for aboveground tree carbon, root carbon and soil organic carbon (SOC) at the landscape scale for the high elevation area mapped of the Cordillera Urubamba. Values estimated using carbon stock values from inaccessible and accessible forest and grassland (Table S8) extrapolated over the areas calculated using landscape mapping (132,660 km2; Tables S1 and S9). Actual values of the carbon stocks can be found in Table S9.