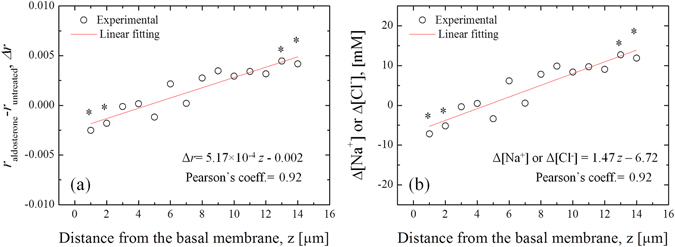
Figure 7.

(a) Difference of the ratio r between treated and untreated cells as calculated in the cytosol of A6 epithelial cells. (b) The data reported in (a) can be converted to variation of [Na+] or [Cl−] in the cytosol using the linear fitting equation reported in the inset of Fig. 3(a). At each z-axis coordinate, the statistically meaningful variations of r and [Na] (or [Cl−]) are marked by *(unpaired t-test, 95% confidence, p < 0.05).
