Figure 4.
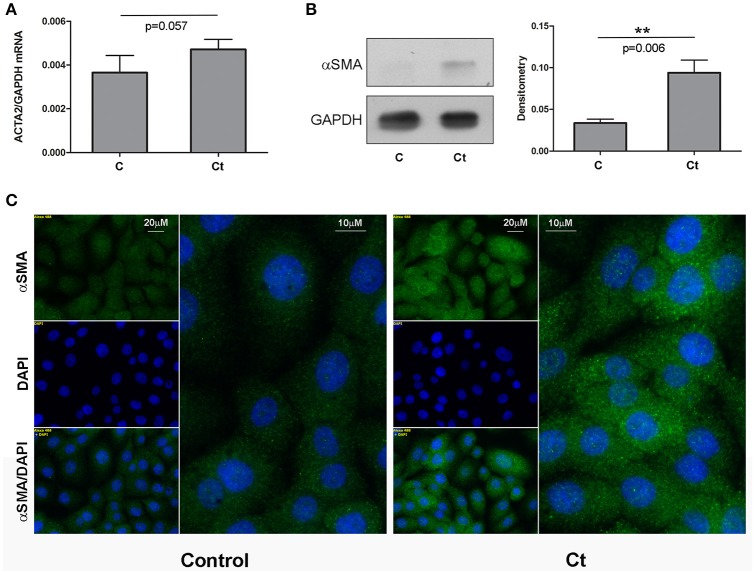
Mesenchymal Marker α-SMA is Upregulated in Response to Ct Infection. (A) mRNA expression levels of ACTA2 in control (C) and HCjE cells after infection with 107 IFU of Ct (Ct) as determined by qRT-PCR. mRNA levels are relative to that of GAPDH and are expressed as means ± SDs. (B) Protein levels of α-SMA in control (C) and Ct-infected HCjE cells (Ct) as determined by immunoblot analysis using anti-α-SMA antibody. Quantitative results of three immunoblots are presented, where α-SMA protein levels are relative to that of GAPDH, which was used as loading control. The results are expressed as means ± SDs. (C) Immunofluorescence analysis of control and Ct-infected HCjE cells with anti-α-SMA antibody (green fluorescence). Nuclei are stained with DAPI (blue fluorescence).

