Figure 5.
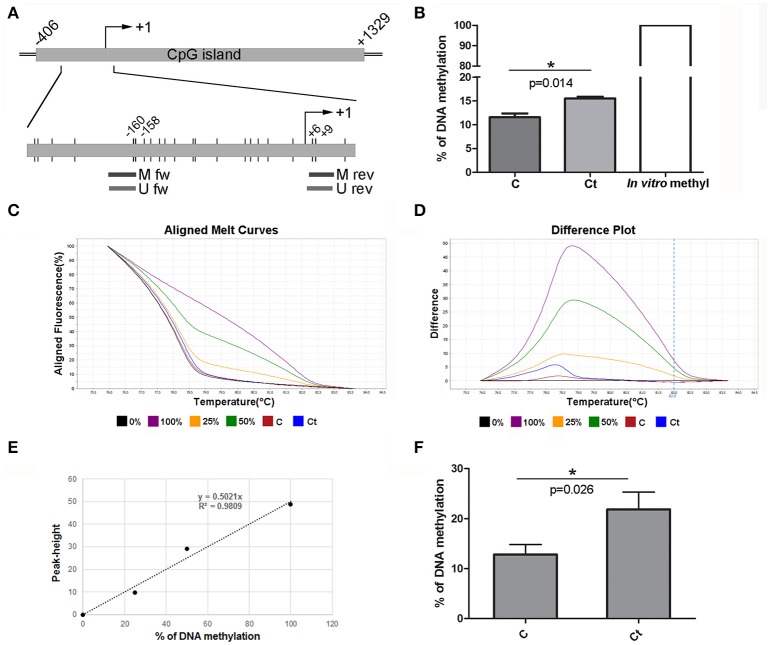
DNA Methylation Status of CDH1 after Infection with Ct. (A) Schematic representation of part of the E-cadherin gene CDH1 encompassing a CpG island. The position of the TSS is marked as “+1,” while the positions of primers used for DNA methylation analysis and of CpG dinucleotides (short vertical lines) are shown in the inset. M fw and M rev, methylated forward and reverse primers respectively; U fw and U rev, unmethylated forward and reverse primers, respectively. (B) Relative levels of methylated products obtained after MSP analysis of CDH1 in control (C) and Ct-infected HCjE cells (Ct) compared to DNA methylated in vitro, assumed to be 100% methylated. The results are expressed as means ± SDs. (C–F) DNA methylation levels of the selected region obtained by HRM analysis. Representative aligned melt curves (C) and difference plots (D) showing positions of C and Ct curves with respect to 0, 25, 50, and 100% methylated standards. (E) Standard curve, plot of peak height versus percent of methylation (obtained as stated in the Materials and Methods section). (F) Bar graph depicting DNA methylation levels obtained from standard curves for three samples of each of control (C) and Ct-infected HCjE cells (Ct). The results are expressed as means ± SDs.

