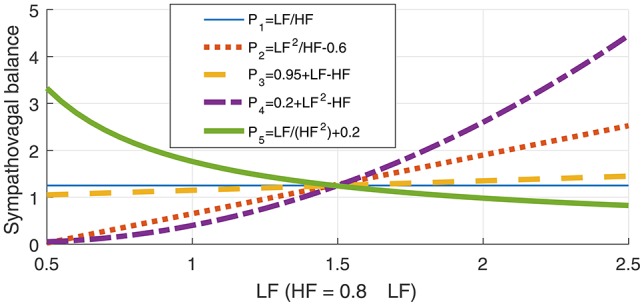
Figure 1.

Illustration of the ambiguity in the LF-HF ratio through a class of possible relationships between the low- (LF) and high-frequency bands (HF) in heart rate variability (HRV), given in Equation (1). The metrics P1 to P5 represent possible sympathovagal balance relationships and are designed so that every metric Pi increases with the activity of the sympathetic nervous system (SNS), and decreases with an increase in the activity of the parasympathetic nervous system (PNS). However, observe that for a constant LFp/HFp ratio, which is believed to indicate a constant sympathovagal balance, the curves for various Pi, i = 1, 2, …, 5 in Equation (1) behave quite differently, which demonstrates the inadequacy of any 1D metrics for the assessment of stress.
