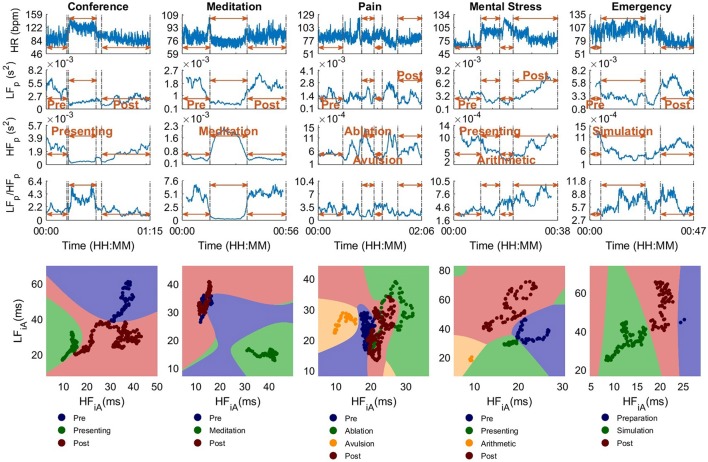
Figure 6.
The standard univariate and the proposed bivariate stress parameters for 250 s sliding time windows, for experiments in Part 2. Upper: Stress parameters in 1D, that is, heart rate (HR), power in the low- (LFp) and high-frequency band (HFp), and their ratio (LFp/HFp). Lower: Proposed 2D stress parameters. The LFiA-HFiA scatter diagrams of the instantaneous Amplitude (iA) in LF and HF, where the background color designates the partitioning into stress categories, achieved through the SVM classifiers. The scatter diagrams in the lower part are more suitable to differentiate between different scenarios than the 1D graphs in the upper part.

