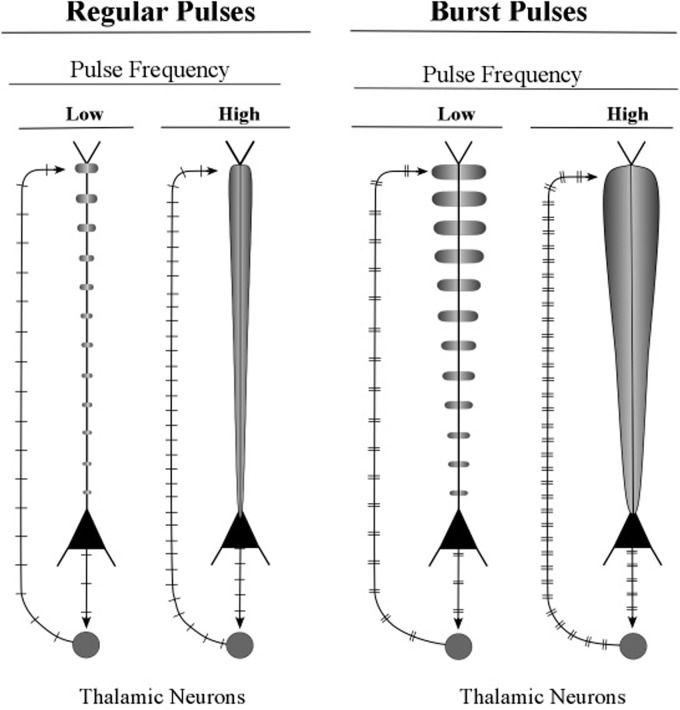
FIGURE 12.
Illustrative graphics of regular-spiking and bursting neuronal activity. The figure shows the carrot-shaped graphics of apical dendrite activity, which depicts the shape of the electric field surrounding the apical dendrite. To the left of each carrot-shape is a vertical line with hatch marks which displays traditional recordings of axon spikes in regular spiking modes and bursting modes, weak and strong.

