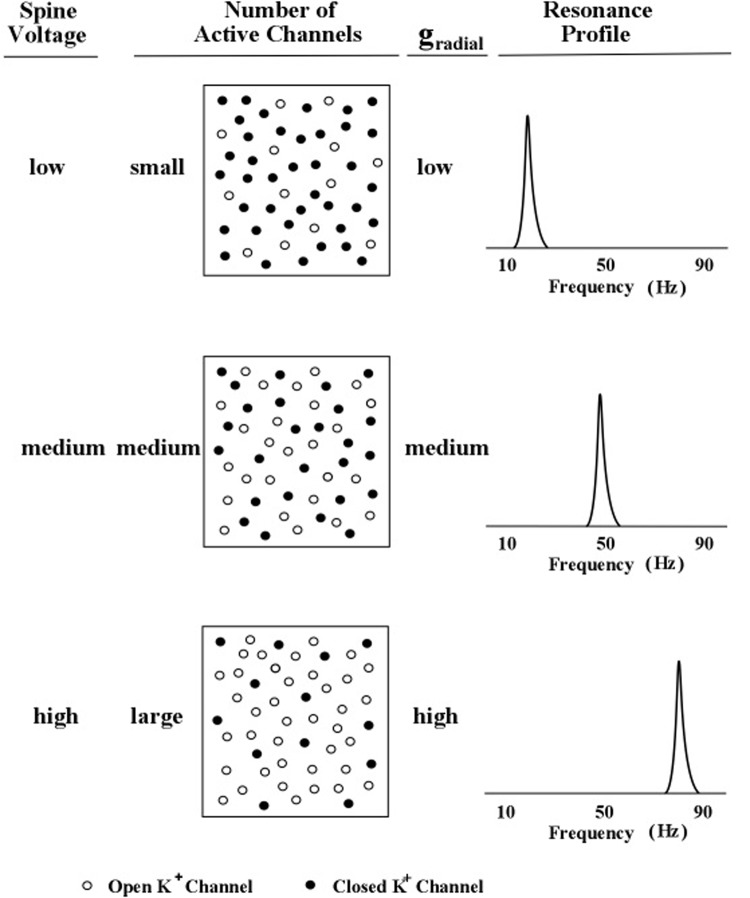
FIGURE 5.
Profile peak frequency and activity of local spines. A schematic diagram of the hypothesized relationship between the peak frequency of a profile curve and the internal voltage level produced by subthreshold activity of an increasing number of local dendritic spines. The rate of outward (radial) potassium flow is denoted by gr. Levels of spine voltage are low, medium, and high; number of active channels are small, medium, and large; and levels of gr are low, medium, and high (Kasevich and LaBerge, 2011).

