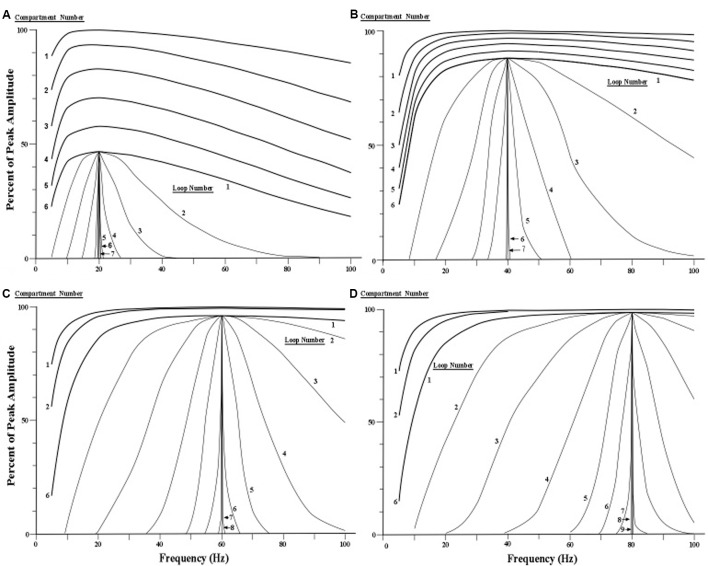
FIGURE 7.
Simulated narrowing of resonance curves. (A–D) Resonance profile curves with peaks at 20, 40, 60, and 80 Hz are narrowed by cycling current repeatedly through six compartments of the apical dendrite via a circuit loop through the thalamus. The profile curves for the first six compartments are shown at the top of each of the four sets of curves (for clarity, the curves for the third, fourth, and fifth compartments are omitted for the 60 and 80 Hz conditions). The remaining curves in each of the four conditions show the effects of subsequent loops through the six compartments via the thalamus. Each curve that is labeled a loop is actually the output of the sixth compartment of each successive loop. [Adapted from Kasevich and LaBerge, 2011].

