
FIGURE 3.
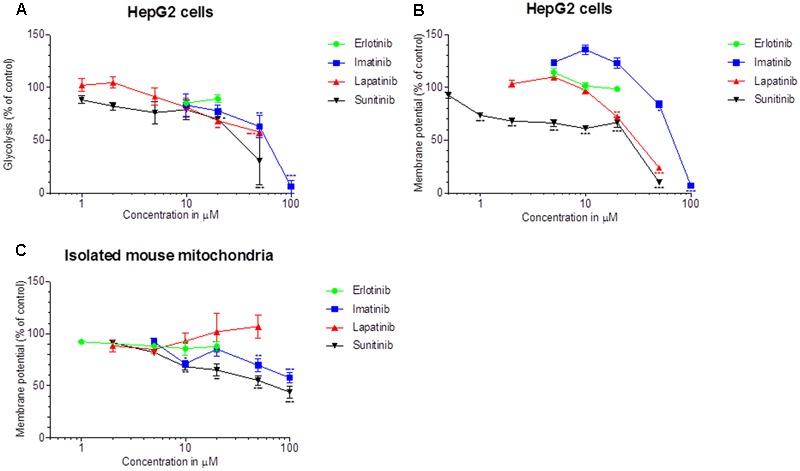
Effect on glycolysis and on the Δψm. (A) Glycolysis was determined using D-3H(U) glucose as a substrate as described in Methods. The rate of glycolysis for the control incubations was 37.5 ± 2.6 nmoles/h/mg protein (mean ± SEM, n = 35 control incubations). (B) The Δψm was assessed in HepG2 cells by TMRM fluorescent staining after drug exposure for 48 h. (C) Isolated mouse liver mitochondria were labeled with [3H]-tetraphenylphosphonium bromide and mitochondrial accumulation of radioactivity was determined. All data are expressed as percentage of control incubations containing 0.1% DMSO. Data represent the mean ± SEM of at least three independent experiments. ∗p < 0.05, ∗∗p < 0.01 or ∗∗∗p < 0.001 versus DMSO control.