FIGURE 4.

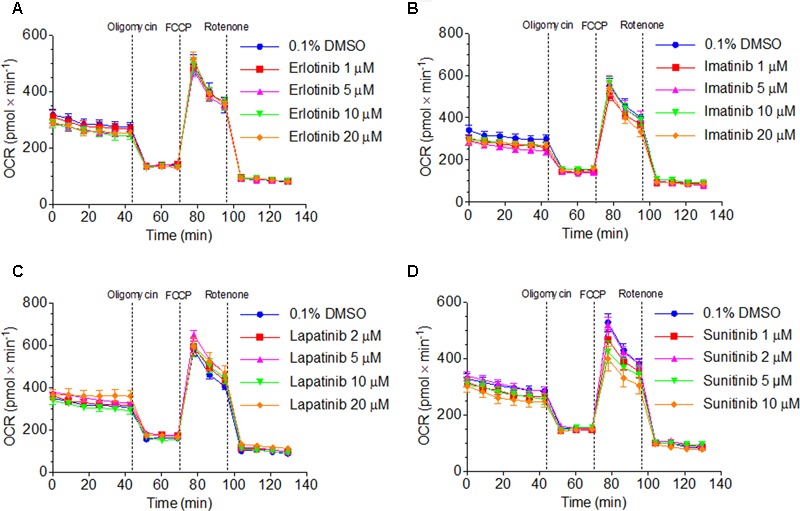
Function of the respiratory chain in HepG2 cells. Oxygen consumption rate after exposure to (A) erlotinib, (B) imatinib, (C) lapatinib or (D) sunitinib for 48 h. Data represent the mean ± SEM of at least three independent experiments.

Function of the respiratory chain in HepG2 cells. Oxygen consumption rate after exposure to (A) erlotinib, (B) imatinib, (C) lapatinib or (D) sunitinib for 48 h. Data represent the mean ± SEM of at least three independent experiments.