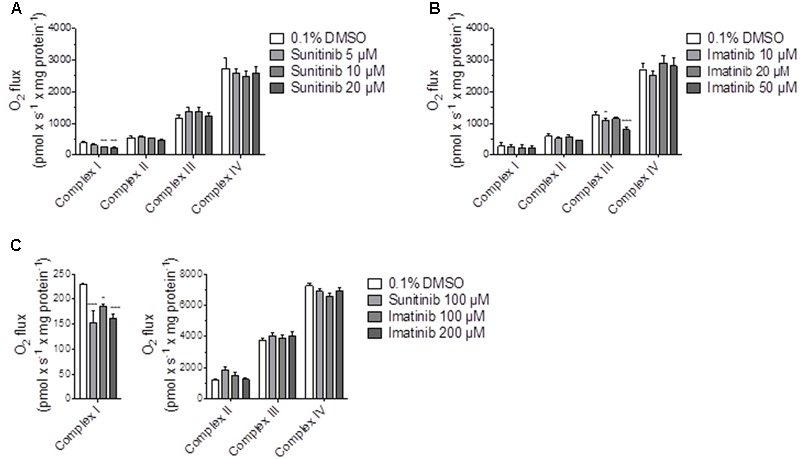
FIGURE 5.

Effect on respiratory capacities through complexes I, II, III, and IV measured on the Oxygraph-2k-high-resolution respirometer. (A,B) Effect on HepG2 cells cultured with galactose after sunitinib and imatinib exposure for 48 h. (C) Effect on isolated mouse liver mitochondria after exposure for 15 min. Data represent the mean ± SEM of at least three independent experiments. ∗p < 0.05, ∗∗p < 0.01 or ∗∗∗p < 0.001 versus DMSO control.
