FIGURE 6.

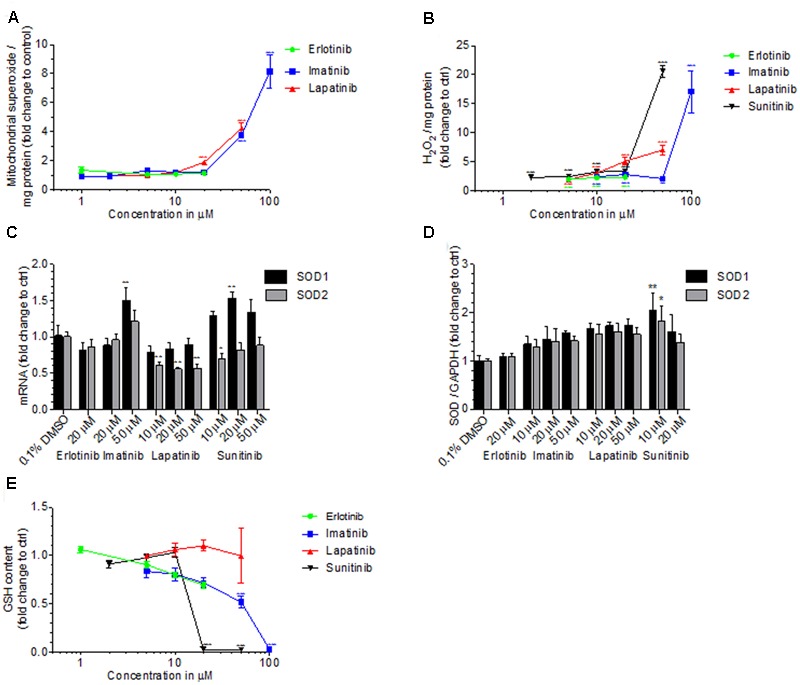
Cellular and mitochondrial ROS production, cellular GSH content and SOD expression. (A) Mitochondrial ROS production by HepG2 cells after drug exposure for 48 h. (B) Production of H2O2 by HepG2 cells after drug exposure for 48 h. (C) mRNA expression of SOD1 and SOD2 in HepG2 cells after drug exposure for 48 h. (D) Protein expression of SOD1 and SOD2 in HepG2 cells after drug exposure for 48 h. (E) GSH content in HepG2 cells after drug exposure for 48 h. Basel GSH concentration of control incubations (0.1% DMSO) was 24.4 ± 6.0 μM. All data are expressed as fold change to control incubations containing 0.1% DMSO. Data represent the mean ± SEM of at least three independent experiments. ∗p < 0.05, ∗∗p < 0.01 or ∗∗∗p < 0.001 versus DMSO control.
