
FIGURE 7.
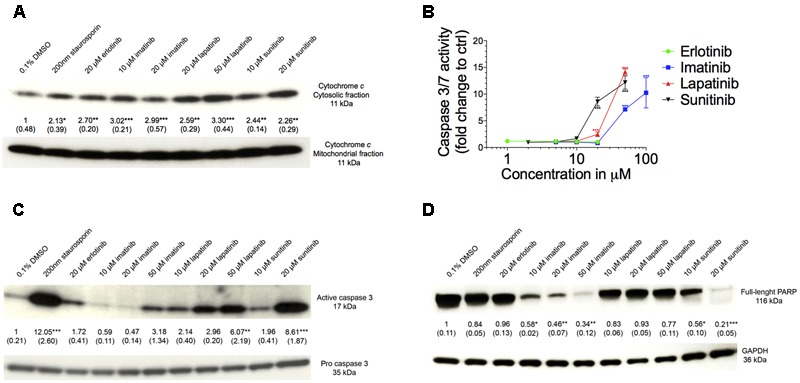
Assessment of apoptosis. (A) Western blot analysis of the ratio of expression of cytochrome c in the cytosolic to mitochondrial fraction. (B) Caspase 3/7 activity in HepG2 cells after drug exposure for 48 h. (C) Western blot analysis of the expression of active to pro caspase 3. (D) Western blot analysis of the expression of full length PARP. All data are expressed as fold change to control incubations containing 0.1% DMSO. Data represent the mean ± SEM of at least three independent experiments. ∗p < 0.05, ∗∗p < 0.01 or ∗∗∗p < 0.001 versus DMSO control.