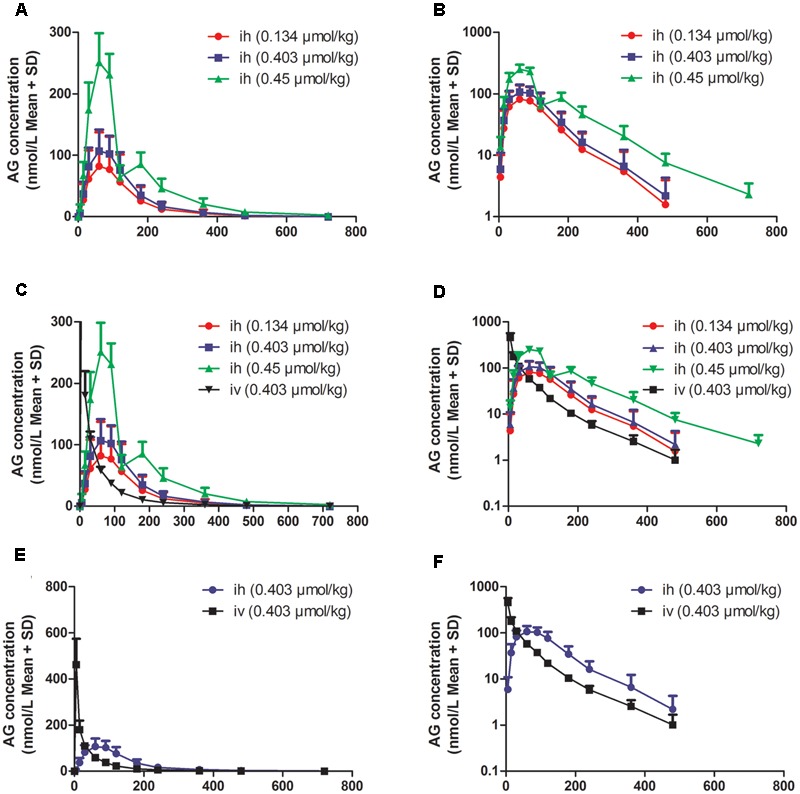
FIGURE 4.

The plasma concentration vs. time profiles of arctigenin in beagle dogs after hypodermic injection (i.h) or intravenous injection (i.v) by arctigenin in different doses. (A,B) The different AG concentrations of beagle dogs’ plasma after i.h AG in 0.134, 0.403, or 0.45 μmol/kg. (C,D) The comparison between i.h and i.v of AG concentration. (E,F) The comparison between i.h and i.v of AG concentration at the dose of 0.403 μmol/kg. The results are shown using normal (left) or semilogarithmic coordinates (right). (n = 6 per treatment group; results are presented as the mean ± SD).
