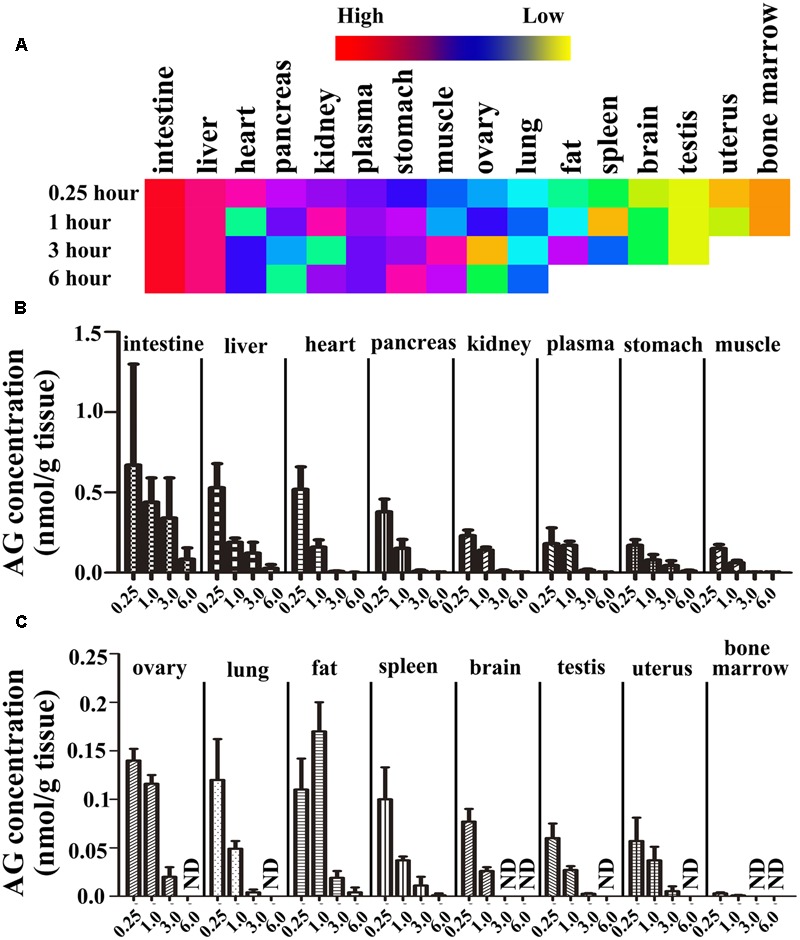
FIGURE 6.

The tissue distribution of arctigenin in rats. (A) The heat map representing the concentration of arctigenin in different tissues after rats were hypodermically injected with 8.061 μmol/L. (B,C) The histogram representing the tissue distributions of arctigenin in rats. (ND means not detected. N = 6 per treatment group; results are presented as the mean ± SD).
