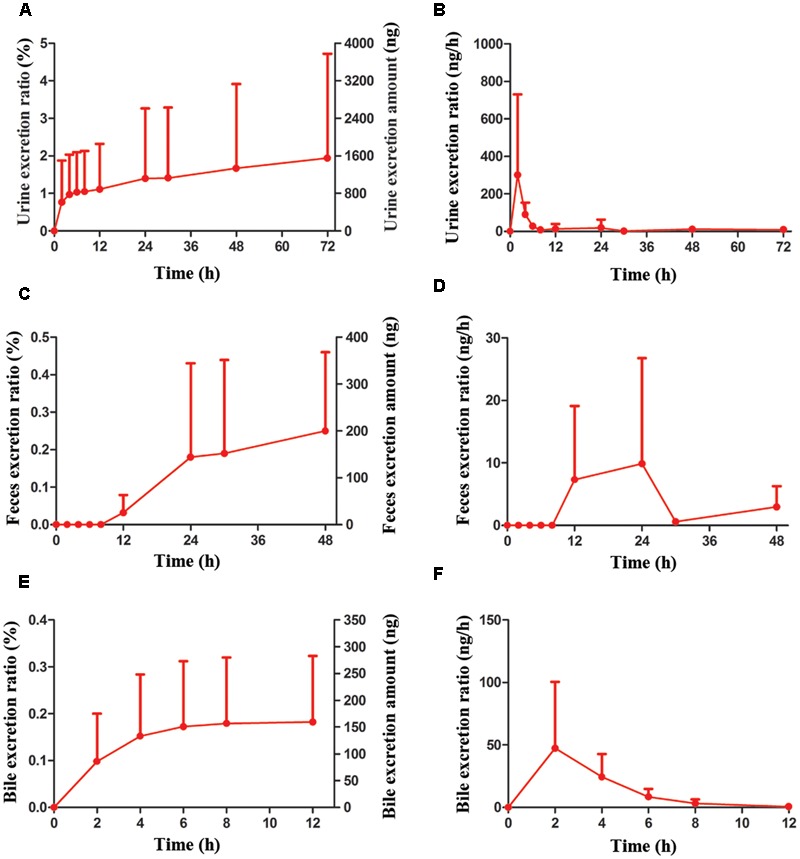
FIGURE 8.

The accumulative excretions and excretion rate of AG (0.806 μmol/kg, i.h) on Wistar rats in different times. (A,B) The urine excretion ratio and amount of AG in rats. (C,D) The feces excretion ratio and amount of AG in rats. (E,F) The bile excretion ratio and amount of AG in rats. (n = 6 per treatment group; results are presented as the mean ± SD).
