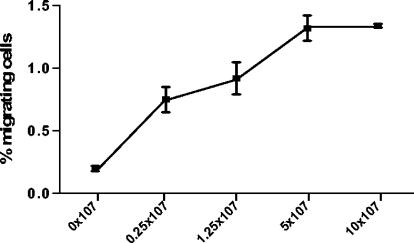
FIG. 1.
Dose-response curve of H. pylori-induced T-cell TEM. PBMC were incubated in Transwell chambers and allowed to migrate toward H. pylori strain Hel 312. The migrating cells were characterized and enumerated by flow cytometry. All samples were run in duplicates, and the number of migrating T cells is expressed as the percentage of the input cells. Squares indicate mean ± the standard error of the mean (SEM) of three different experiments.

