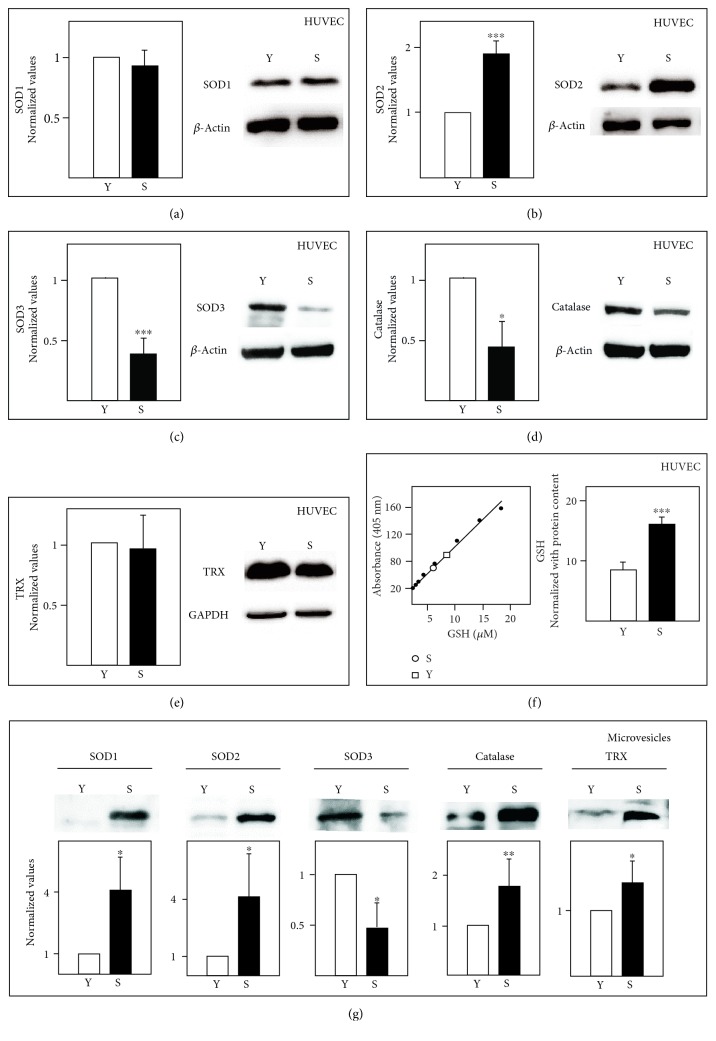
Figure 2.
Western blot analysis of SOD1, SOD2, SOD3, catalase, and TRX in HUVECs (a–e) and MVs (g). GSH (total content) was analysed using a specific kit (f); the left panel shows the standard curve and the right panel the total GSH content. Y: young; S: senescent. HUVEC protein data were normalized against β-actin (a–d) or GAPDH (e); however, the GSH data (f) were normalized against the protein content of the sample. Protein data for the MVs was normalized against the intensity of red Ponceau staining. Bars represent mean ± SD (n = 3 pools). ∗p < 0.05, ∗∗p < 0.01, ∗∗∗p < 0.001.

