
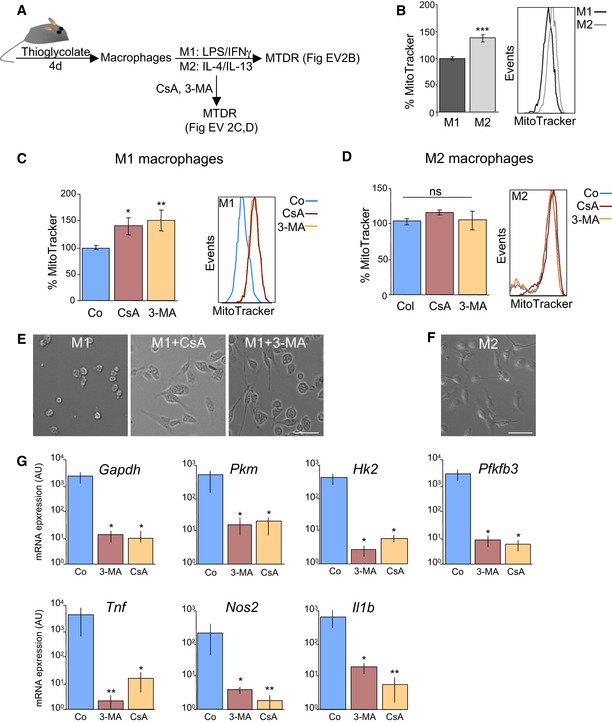
Figure EV2. Mitophagy sustains glycolysis in M1 macrophages.
-
ASchematic showing experimental design.
-
BMouse peritoneal macrophages were isolated from adult mice treated for 4 days with thioglycolate and were then incubated in the presence of LPS and IFN‐γ to induce M1 polarization or with IL‐4/IL‐13 to induce the M2 phenotype. Cells were then stained with MitoTracker and assessed by flow cytometry (n = 12 per group). Data are presented as mean ± SEM. ***P < 0.001 (Mann‐Whitney U‐test).
-
C, DM1 (C) or M2 (D) macrophages were incubated for 6 h with 10 mM 3‐MA or 5 μM CsA, and MitoTracker staining was assessed by flow cytometry (C, n = 6–9 per group; D, n = 6–9 per group). Data are presented as mean ± SEM. *P < 0.05, **P < 0.01 (Mann‐Whitney U‐test).
-
E, FRepresentative images of M1 macrophages (E) after incubation with 3‐MA or CsA and M2 macrophages (F). Scale bars, 50 μm.
-
GmRNA expression of the indicated genes in M1 macrophages cultured in the presence of 10 mM 3‐MA or 5 μM CsA (n = 6 per group). Data are presented as mean ± SEM. *P < 0.05, **P < 0.01 (ANOVA).