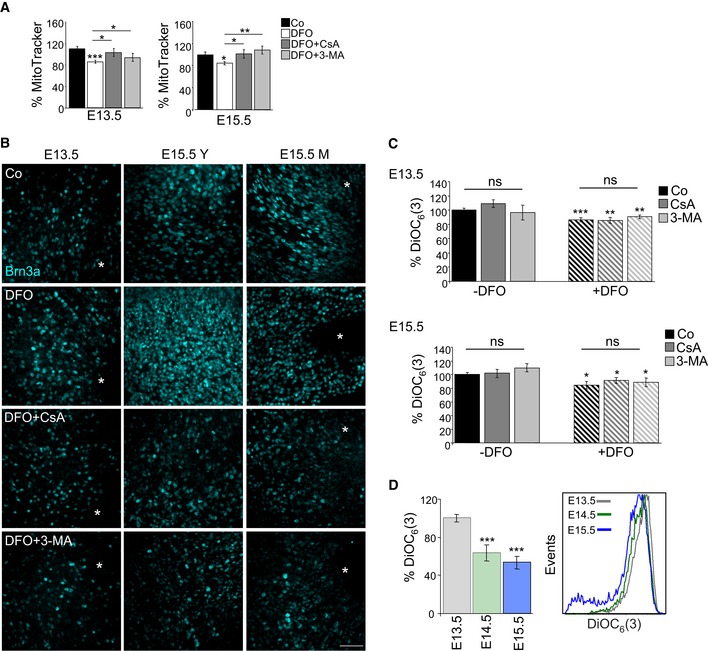
Percentage mean fluorescence intensity (% MitoTracker) in E13.5 and E15.5 retinas incubated for 6 h with DFO in the absence or presence of 3‐MA or CsA (n = 8–14 retinas per group). Data are presented as mean ± SEM. *P < 0.05, **P < 0.01, ***P < 0.001 (Mann‐Whitney U‐test and Student's t‐test).
Assessment of RGC differentiation by Brn3a immunostaining in retinal flatmounts. Image shows Brn3a immunostaining in retinal flatmounts corresponding to E13.5 and E15.5 retinas incubated with the hypoxia inducer DFO (1 mM) in the absence or presence of CsA or 3‐MA. Scale bar, 50 μm. Y (young) indicates the peripheral area of the E15.5 retina containing less mature RGCs, and M (mature) indicates the centre of the retina, containing more mature RGCs.
Chemical hypoxia results in decreased mitochondrial membrane potential as determined by flow cytometry with DiOC6(3) in E13.5 (n = 5–24 retinas per group) and E15.5 (n = 9–21 retinas per group) retinas incubated with the hypoxia inducer DFO (1 mM) in the absence or presence of CsA or 3‐MA. Data are presented as mean ± SEM. *P < 0.05, **P < 0.01, ***P < 0.001 (Mann‐Whitney U‐test).
Determination of mitochondrial membrane potential by flow cytometry with DiOC6(3) in retinas at the indicated embryonic stages (n = 10–16 retinas per group). Data are presented as mean ± SEM. ***P < 0.001 (Mann‐Whitney U‐test).

