-
A
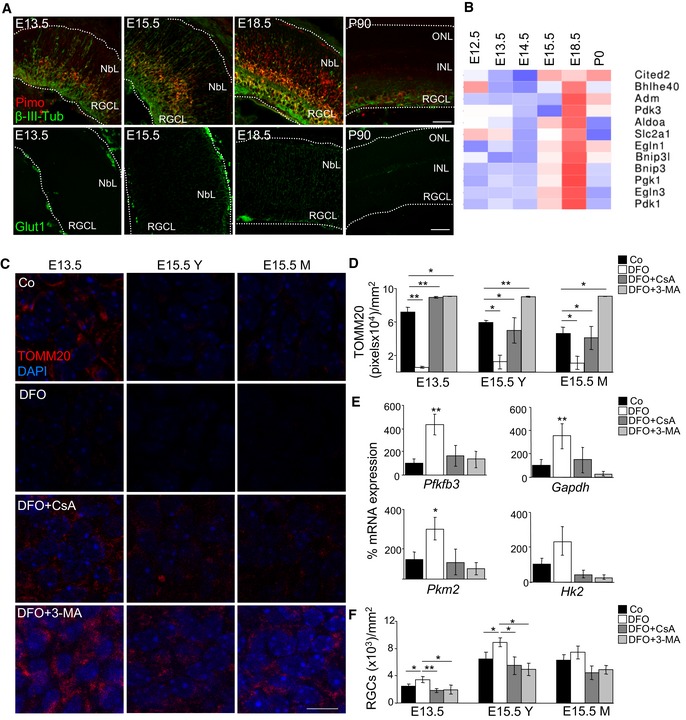
Immunostaining for pimonidazole (red), β‐III‐tubulin (green, upper row) and SLC2A1 (green, bottom row) in mouse eye sections at the indicated stages. NbL, neuroblast layer; RGCL, retinal ganglion cell layer; INL, inner nuclear layer; ONL, outer nuclear layer. Scale bar, 50 μm.
-
B
Heat map showing the relative mRNA expression of HIF‐1 alpha target genes as determined by transcriptomic analyses in mouse retinas at the indicated developmental stages.
-
C, D
TOMM20 immunostaining and corresponding quantification in retinal flatmounts corresponding to E13.5 and E15.5 retinas incubated with the hypoxia inducer DFO (1 mM) in the absence or presence of CsA or 3‐MA (n = 3–8 retinas per group). Scale bar, 10 μm. Y (young) indicates the peripheral area of the E15.5 retina containing less mature RGCs, and M (mature) indicates the centre of the retina, containing more mature RGCs. Data are presented as mean ± SEM. *P < 0.05, **P < 0.01 (Mann‐Whitney U‐test).
-
E
mRNA expression of the indicated genes in E15.5 retinas treated as in C (n = 3–8 pools of two retinas per group). Data are presented as mean ± SEM. *P < 0.05, **P < 0.01 (Mann‐Whitney U‐test).
-
F
Quantification of RGC number after Brn3a immunostaining in retinas treated as in (C) (n = 3–9 per group). Data are presented as mean ± SEM. *P < 0.05, **P < 0.01 (Mann‐Whitney U‐test).

