-
A
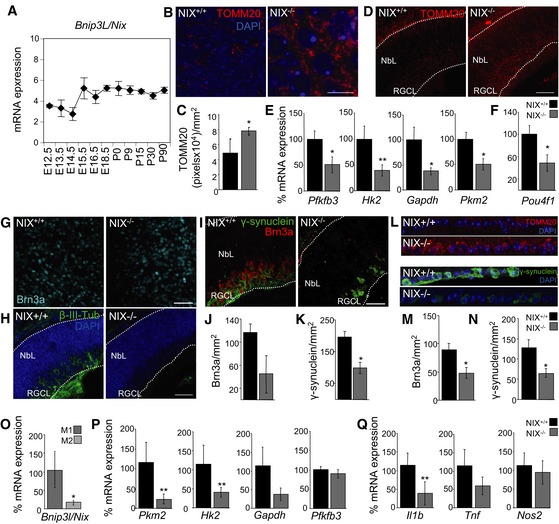
qPCR measurement of BNIP3L/NIX mRNA expression in mouse retinas at indicated developmental stages (n = 2–3 pools of retinas per embryonic stage). Data are presented as mean ± SEM.
-
B, C
TOMM20 immunostaining (B) and corresponding quantification (C) (n = 4–8 retinas per group) in retinal flatmounts from wild‐type and NIX‐deficient mice at E15.5. Scale bar, 10 μm. Data are presented as mean ± SEM. *P < 0.05 (Mann‐Whitney U‐test).
-
D
Immunostaining for TOMM20 (red) in retinal sections from E15.5 wild‐type and NIX‐deficient mice. DAPI‐stained nuclei are shown in blue. NbL, neuroblast layer; RGCL, retinal ganglion cell layer. Scale bar, 75 μm.
-
E
mRNA expression of the indicated genes in E15.5 wild‐type (NIX+/+) and NIX‐deficient (NIX−/−) mouse retinas (n = 5–8 pools of two retinas per group). Data are presented as mean ± SEM. *P < 0.05, **P < 0.01 (Mann‐Whitney U‐test).
-
F
mRNA expression of Pou4f1 (Brn3a) in E15.5 wild‐type (NIX+/+) and NIX‐deficient (NIX−/−) retinas (n = 5–8 pools of two retinas per group). Data are presented as mean ± SEM. *P < 0.05 (Student's t‐test).
-
G
Assessment of RGC differentiation by Brn3a immunostaining in retinal flatmounts from E15.5 wild‐type (NIX+/+) and NIX‐deficient (NIX−/−) mice. Scale bar, 50 μm.
-
H
β‐III‐tubulin immunostaining (green) in retinal sections from E15.5 wild‐type and NIX−/−‐deficient mice. DAPI‐stained nuclei are shown in blue. NbL, neuroblast layer; RGCL, retinal ganglion cell layer. Scale bar, 75 μm.
-
I
Brn3a (red) and γ‐synuclein (green) staining in retinal sections from E15.5 wild‐type and NIX‐deficient mice. Scale bar, 50 μm.
-
J
Quantification of RGC number after Brn3a immunostaining in the RGC layer in eye sections from E15.5 wild‐type (NIX+/+) and NIX‐deficient (NIX−/−) mice (n = 4 eyes per group). Data are presented as mean ± SEM (Mann‐Whitney U‐test).
-
K
Quantification of RGC number after γ‐synuclein immunostaining in the RGC layer in eye sections from E15.5 wild‐type (NIX+/+) and NIX‐deficient (NIX−/−) mice (n = 4 eyes per group). Data are presented as mean ± SEM. *P < 0.05 (Mann‐Whitney U‐test).
-
L
Immunostaining of the RGCL for TOMM20 (red), γ‐synuclein (green) and DAPI (blue) in retinal sections from adult wild‐type and NIX‐deficient mice.
-
M
Quantification of RGC number after Brn3a immunostaining in the RGC layer in eye sections from adult wild‐type (NIX+/+) and NIX‐deficient (NIX−/−) mice (n = 3 eyes per group). Data are presented as mean ± SEM. *P < 0.05 (Mann‐Whitney U‐test).
-
N
Quantification of RGC number after γ‐synuclein immunostaining in the RGC layer in eye sections from adult wild‐type (NIX+/+) and NIX‐deficient (NIX−/−) mice (n = 3 eyes per group). Data are presented as mean ± SEM. *P < 0.05 (Mann‐Whitney U‐test).
-
O
qPCR measurement of BNIP3L/NIX mRNA expression in M1 and M2 macrophages (n = 6 per group). Data are presented as mean ± SEM. *P < 0.05 (Mann‐Whitney U‐test).
-
P, Q
qPCR measurement of mRNA expression of glycolytic (P) and proinflammatory markers (Q) in M1 peritoneal macrophages from wild‐type (NIX+/+) and NIX‐deficient (NIX−/−) mice (n = 6–8 per group). Data are presented as mean ± SEM. **P < 0.01 (Mann‐Whitney U‐test).

