
Figure EV2. The association of GFP‐CERT with TGN membranes depends on SL flow.
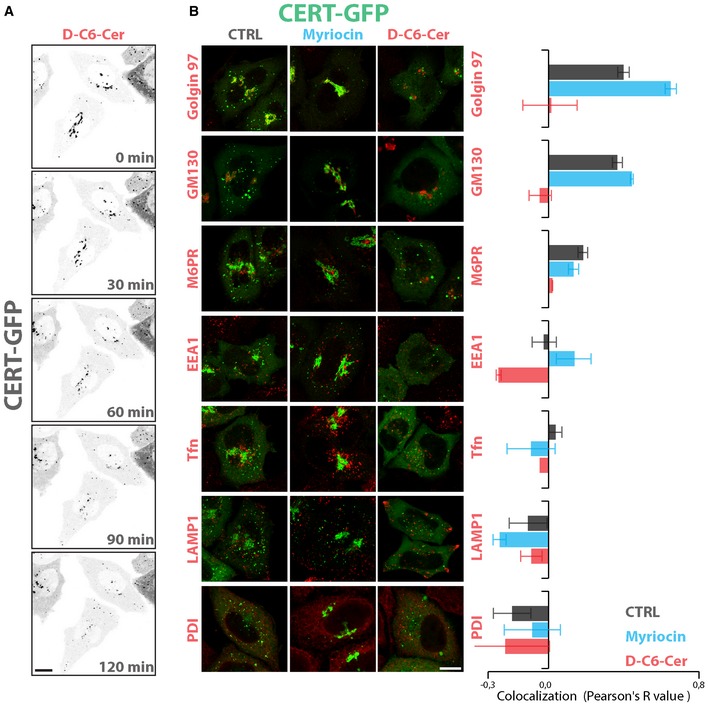
- GFP‐CERT localization in HeLa cells, pre‐treated with myriocin (2.5 μM, 24 h) and then treated with D‐C6‐Cer (10 μM) for 2 h. Images are selected frames from Movie EV1. Scale bar, 10 μm.
- GFP‐CERT co‐localization with the indicated organelle markers in HeLa cells either non‐treated (CTRL, grey), treated with myriocin (2.5 μM, 24 h) (myriocin, cyan) or pre‐treated with myriocin (2.5 μM, 24 h) and then treated with D‐C6‐Cer (10 μM) for 2 h (D‐C6‐Cer; red). Left panels: representative images. Right panel: co‐localization values calculated as Pearson's correlation coefficients (R‐values) between GFP‐CERT and the indicated markers under the different treatments. Scale bar, 10 μm. Data are means ± SEM from at least 3 independent experiments where at least 10 cells per experiment were considered.