
Figure 4. Cer‐to‐SM conversion controls PtdIns(4)P levels at the TGN .
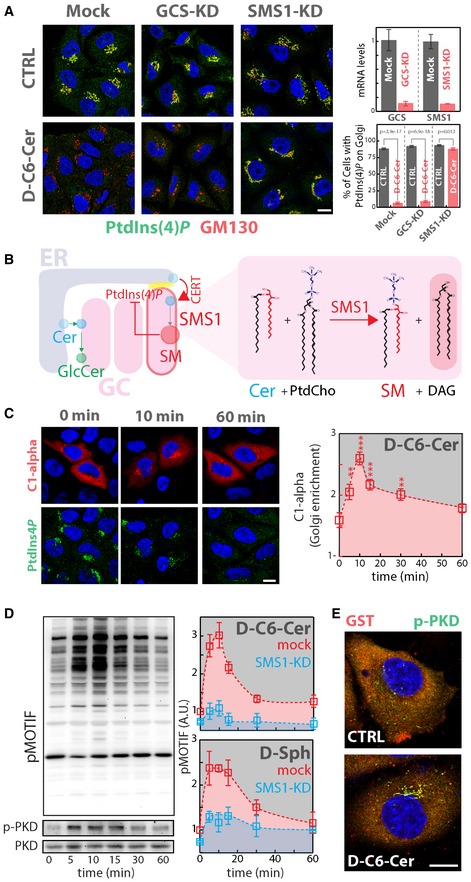
- Cells KD for GCS or SMS1 were treated with D‐C6‐Cer (10 μM) for 2 h, fixed, permeabilized and stained as in Fig 3A. KD efficiencies are indicated as reduction in mRNA levels as assessed by RT‐qPCR (upper right panel). The percentage of cells showing PtdIns(4)P staining at the Golgi in CTRL and D‐C6‐Cer‐treated cells is reported (lower right panel). Two‐tailed Student's t‐test.
- Schematic representation of the feedback loop regulating SM synthesis through PtdIns(4)P (left panel). Biochemical depiction of Cer‐to‐SM conversion operated by SMS1.
- Cells expressing the GST‐tagged DAG sensor PKD‐C1α domain (C1‐alpha) were treated for the indicated times with D‐C6‐Cer (10 μM), fixed, permeabilized and stained with DAPI (blue), anti‐GST (red) and anti‐PtdIns(4)P (green) antibodies (left panel). The Golgi‐associated C1‐alpha fraction at the different time points is reported (right panel). Yellow dotted line indicates the concentration of SL precursor where effects of sustained SL flow on metabolism start to be observed. **P < 0.01; ***P < 0.001; according to two‐tailed Student's t‐test.
- Cells treated with D‐C6‐Cer (10 μM) for the indicated times were lysed and lysates were processed for SDS–PAGE and Western blotting (as detailed in Materials and Methods). Antibodies recognizing total PKD (PKD), phospho‐Ser916‐PKD (p‐PKD) and phosphorylated PKD substrates (pMOTIF) were used to monitor PKD activation (left panels). PKD activation in both mock (red) and SMS1‐KD (cyan) cells was evaluated by quantitating phosphorylation of PKD substrates during D‐C6‐Cer (10 μM) or D‐Sph (30 μM) administration. Yellow dotted line indicates the concentration of SL precursor where effects of sustained SL flow on metabolism start to be observed.
- Cells transfected with a plasmid encoding GST‐PKD2 were treated with D‐C6‐Cer (10 μM) for 15 min, fixed, permeabilized and stained with DAPI (blue), anti‐GST (red) and anti‐p‐PKD (green).