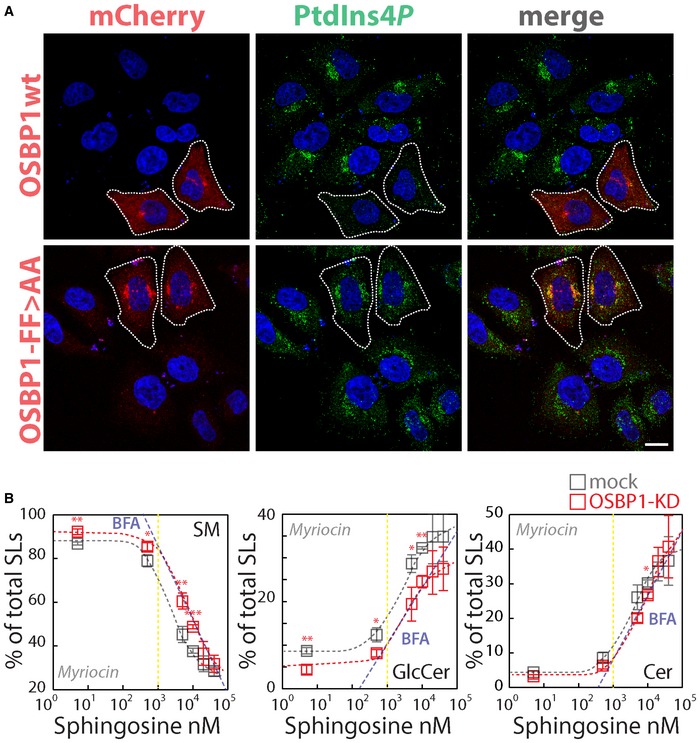
Cells KD for OSBP1 were treated with myriocin (2.5 μM) for 24 h and fed with increasing concentrations of D‐Sph for 2 h.
3H‐D‐Sph (≈5 nM) was mixed as a tracer with its non‐radioactive counterpart. The percentage of total radioactivity associated with SM (left panel), GlcCer (middle panel) and Cer (right panel) in mock (grey) and OSBP1‐KD cells (red) was quantitated after lipid extraction and HPTLC separation. The blue dashed line represents the values obtained under BFA treatment (from Fig
1B). Data are means ± SEM from at least 4 independent experiments. *
P < 0.05; **
P < 0.01; ***
P < 0.001; according to two‐tailed Student's t‐test.