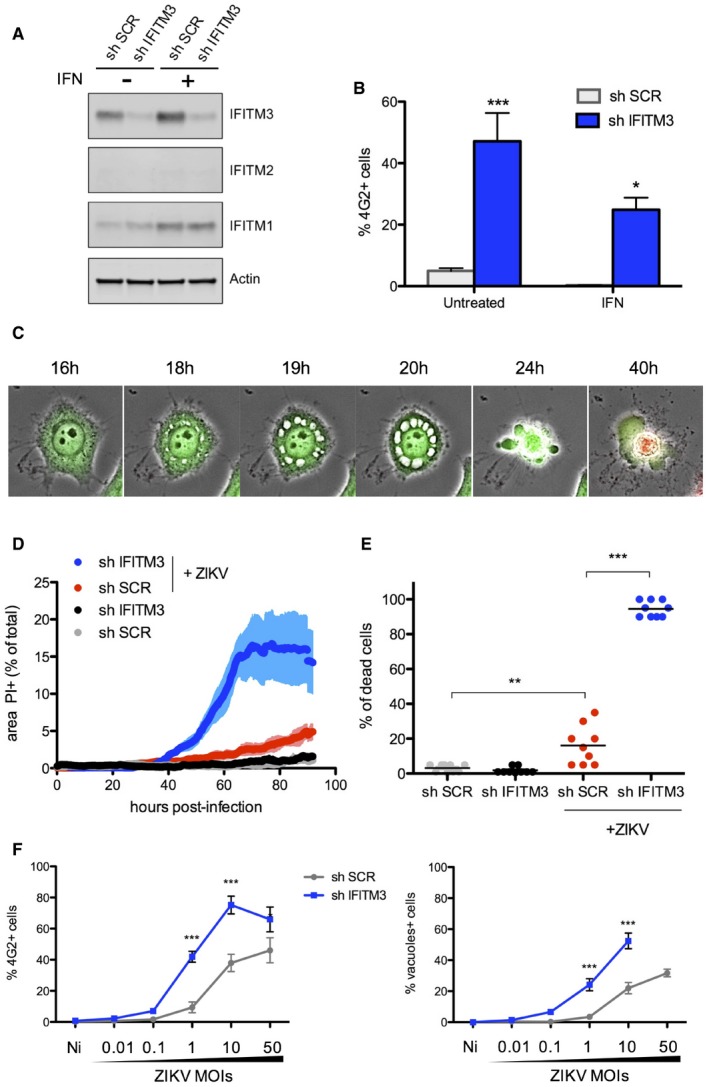
Figure 1. ZIKV‐induced cytopathic effects and cytoplasmic vacuolization.

- HeLa cells were transduced to stably express a control scrambled shRNA (sh‐SCR) or shRNA targeting IFITM3 (sh‐IFITM3). The level of endogenous IFITMs in the presence or absence of IFN‐α (1,000 IU/ml for 48 h) was assessed by Western blot.
- HeLa sh‐SCR or sh‐IFITM3 treated or not with IFN‐α were infected with ZIKV HD78 (MOI 1), and the % of E‐positive cells was determined by flow cytometry at day 2 pi. Mean ± SEM of three independent experiments.
- HeLa sh‐SCR or sh‐IFITM3 cells were infected with ZIKV (MOI 1) for 2–4 days in the presence of propidium iodide (PI) for time‐lapse microscopy. The cells also expressed GFP to facilitate visualization of the cytoplasm and the vacuoles. Still images were extracted from Movie EV1 (from HeLa sh‐IFITM3 infected cells) at the indicated time points.
- The area of the PI+ signal was quantified for each condition. Nine fields from three independent experiments were analyzed and plotted as mean ± SEM. Movie EV3 is a representative example of data used for quantification.
- The % of dead cells from 9 fields was visually scored at day 3 pi and plotted as mean.
- ZIKV E expression determined by flow cytometry and the proportion of cells displaying vacuoles was scored by visual examination of at least 200 cells at 24 h pi in HeLa sh‐SCR or sh‐IFITM3 cells infected with the indicated MOIs. Mean ± SEM of three independent experiments is shown.
