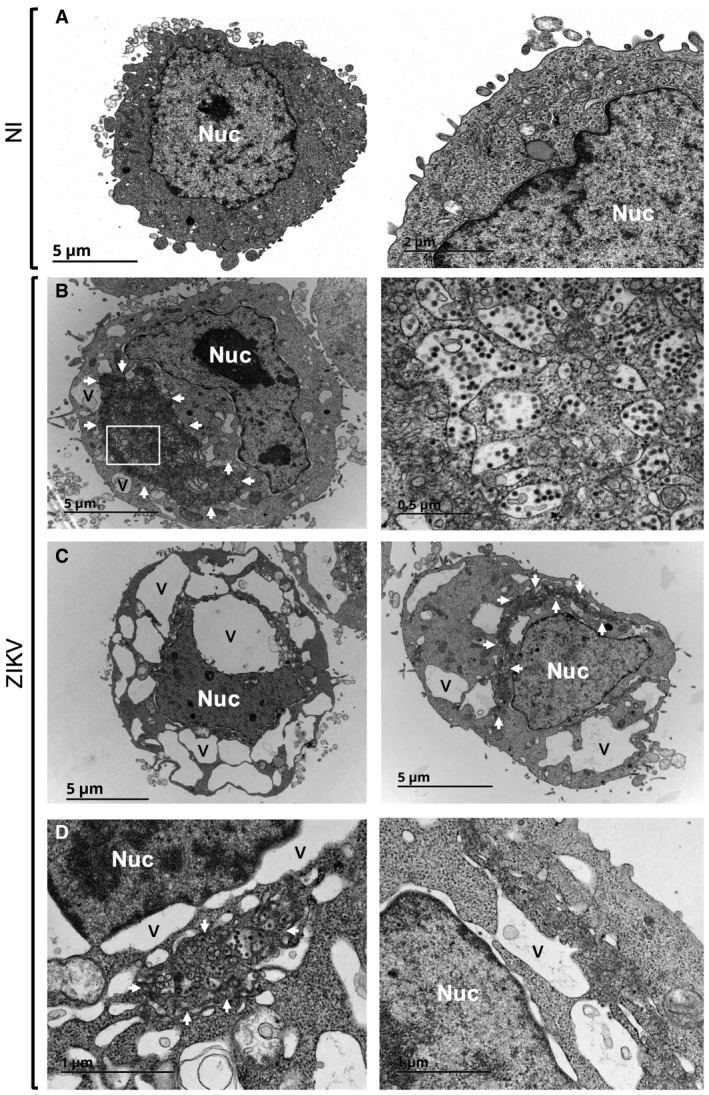
Figure 4. Ultrastructural analysis of ZIKV‐infected HeLa cells.

- Transmission electron microscopy (TEM) of non‐infected HeLa sh‐IFITM3 cells.
- TEM of ZIKV‐infected HeLa sh‐IFITM3 cells at 24 h pi displays cytoplasmic vacuolization (indicated with the letter V) and active virion production (enlarged on the right).
- Examples of ZIKV‐infected cells exhibiting large vacuoles.
- Enlarged views of dilated nuclear membranes in ZIKV‐infected cells.
