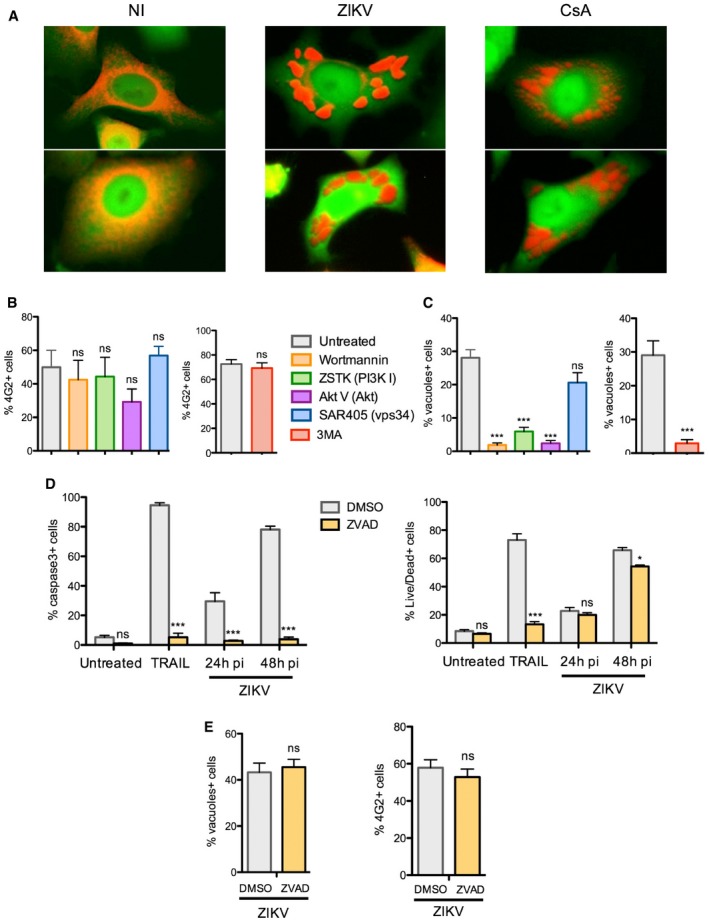
Figure 6. ZIKV triggers paraptosis‐like cell death.

-
AComparison of large cytoplasmic vacuoles induced by ZIKV or cyclosporine A. HeLa sh‐IFITM3 expressing the fluorescent ER‐tracker were infected with ZIKV HD 78 (MOI 1) or treated with cyclosporin A (10 μM) for 2 days and analyzed by time‐lapse microscopy. Two representative still images for each condition are shown.
-
B, CHeLa sh‐IFITM3 were infected with ZIKV HD 78 (MOI 1) for 24 h in the presence or absence of the pan PI3K inhibitor Wortmannin, the class 1‐specific PI3K inhibitor ZSTK474 (1 μM), the Akt inhibitor Triciribine (Akt V) (20 μM), the class 3‐specific PI3K (vps34) inhibitor SAR405 (1 μM), or the pan‐PI3K inhibitor 3MA (5 mM). (B) The percentage of E+ cells was quantified with 4G2 staining and flow cytometry. (C) In parallel, the proportion of cells displaying vacuoles was scored by visual examination of at least 200 cells. Results are mean ± SEM for three independent experiments. Statistical significance was determined using unpaired t‐tests. ***P < 0.001; ns, P > 0.05.
-
D, EHeLa sh‐IFITM3 were infected with ZIKV HD 78 (MOI 1) for 24 or 48 h in the presence or absence of the pan‐caspase inhibitor ZVAD‐FMK. (D) The percentage of cells expressing activated caspase‐3 (left panel) and the percentage of dying cells quantified with live/dead staining (right panel) were measured by flow cytometry. The apoptosis inducer TRAIL was used as a control. (E) The percentage of E+ cells was quantified with 4G2 staining and flow cytometry (left panel). In parallel, the proportion of cells displaying vacuoles was scored by visual examination of at least 200 cells (right panel). Results are mean ± SEM for three independent experiments. Statistical significance was determined using ANOVA and Bonferroni post‐tests (D) or unpaired t‐tests (E).***P < 0.001; *P < 0.05; ns, P > 0.05.
