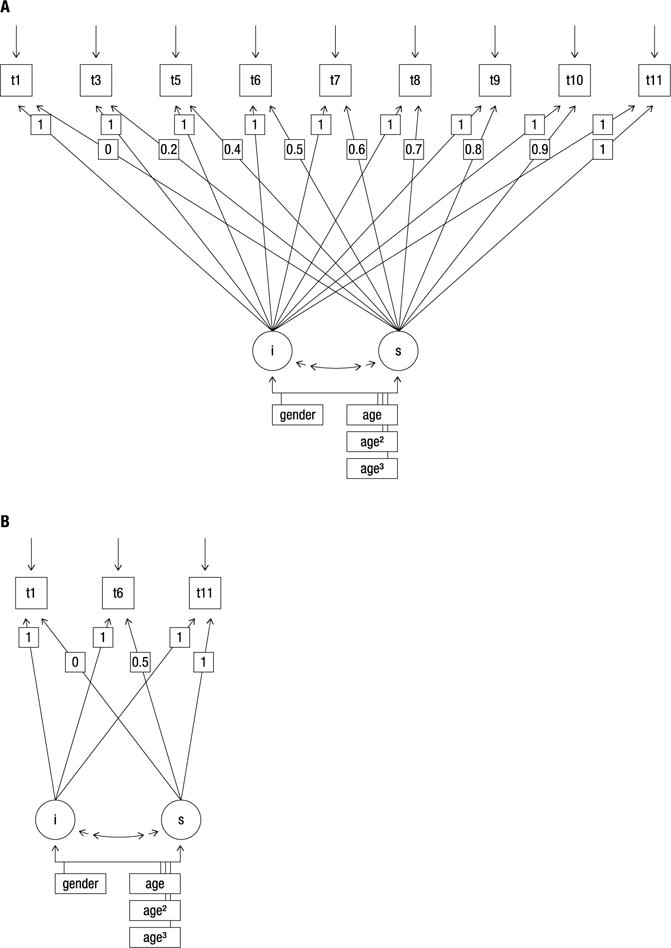
Figure 1.

Model representation of the latent change model used to analyze effects of age and sex on the mean level (intercept) and mean-level change (slope) of self-reported domain-general (A) and domain-specific (B) risk propensity (2004–2014). A. At each measurement point (t1 to t11) one item was assessed. The latent intercept (i) is fixed to 1 on t1, t3, t5, t6, t7, t8, t9, t10, and t11 and refers to the estimated mean frequency of risk-taking propensity at t1. The latent slope (s) is fixed to 0.00 on t1, to 0.20 on t3, to 0.40 on t5, to 0.50 on t6, to 0.60 on t7, to 0.70 on t8, 0.80 on t9, to 0.90 on t10, and to 1 on t11 and refers to the estimated mean difference between two neighboring measurement points. Two-headed arrows represent correlations; single-headed arrows, regression coefficients. Gender, age, age2, and age3 were included as predictors of (i) and (s). B. At each measurement point (t1, t5, t10) one item was assessed. The latent intercept (i) is fixed to 1 on t1, t5, and t10 and refers to the estimated mean frequency of risk-taking propensity at t1. The latent slope (s) is fixed to 0.00 on t1, to 0.50 on t5, to 1 on t10 and refers to the estimated mean difference between two neighboring measurement points. Two-headed arrows represent correlations; single-headed arrows, regression coefficients. Gender, age, age2, and age3 were included as predictors of (i) and (s).
