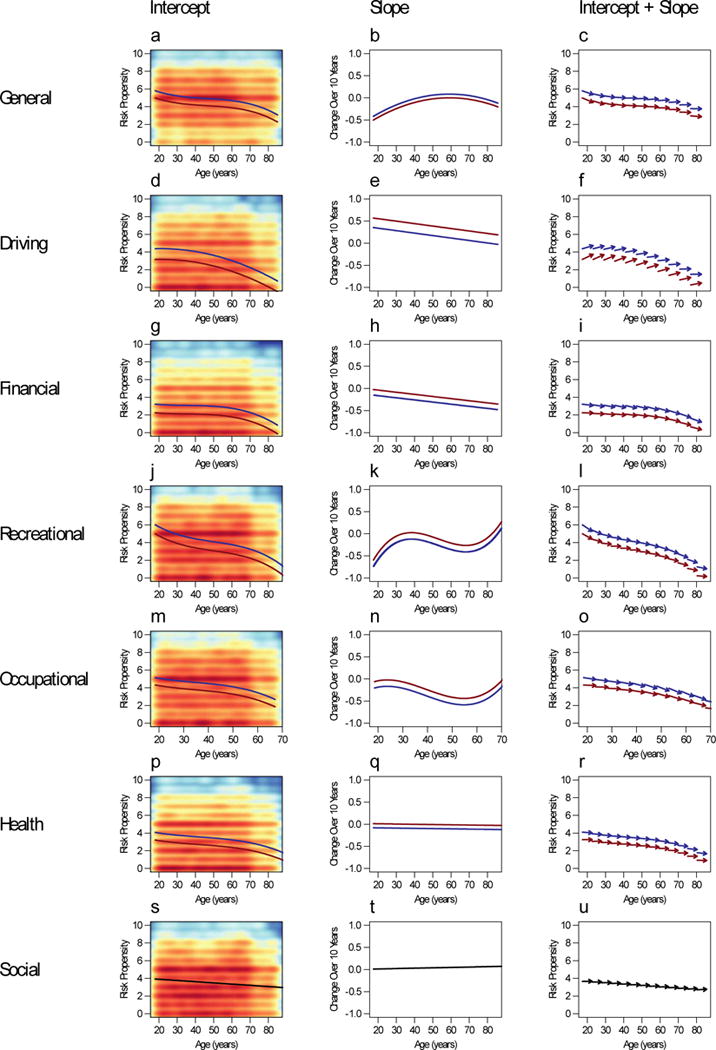
Figure 4.

Age-differences in mean levels (intercepts) and mean-level changes (slopes). Arrows (intercept + slope) represent a combined display of age differences in intercepts and slopes for 11 different cohorts. Red line = female, blue line = male. Single black line = no sex difference. All curves in the Intercept plots (a, d, g, j, m, p, s) are plotted on a kernel density plot in which darker red colors indicate higher density of responses (kernel width used for density estimation = 75). General risk propensity (N = 44,076). Driving risk propensity (N = 11,903). Financial risk propensity (N = 11,903). Recreational risk propensity (N = 11,903). Occupational risk propensity (N = 11,903). Health risk propensity (N = 11,903). Social risk propensity (N = 11,903).
