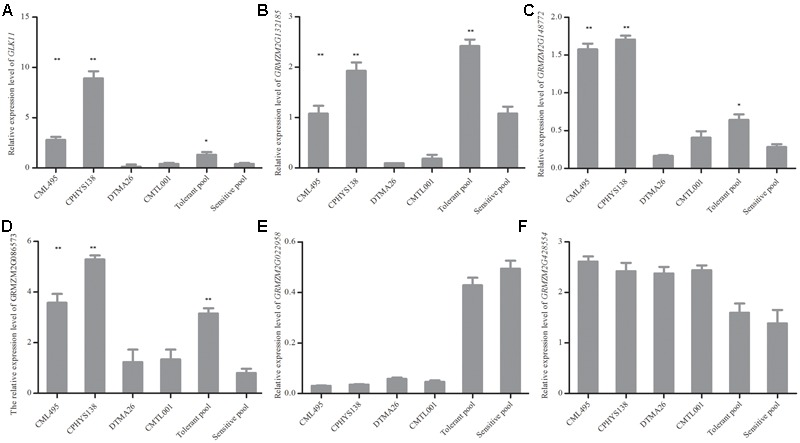
FIGURE 2.

Changes of expression levels for six genes were revealed by RNA-seq and validated by qRT-PCR. (A–F) Relative expression level of GLK11, GRMZM2G132185, GRMZM2G148772, GRMZM2G086573, GRMZM2G022958, and GRMZM2G428554, respectively. Approximately 0.2 g of roots were excised from six seedlings and used for RNA isolation. Six genes were selected based on RNA-seq results, and their expression levels were validated by qRT-PCR. All experiments included three biological replications. Each bar represents the fold change in expression level of the gene by comparing waterlogged with normal conditions. Student’s t-test was performed. ∗Indicates p < 0.05; ∗∗indicates p < 0.01.
