
Figure 6.
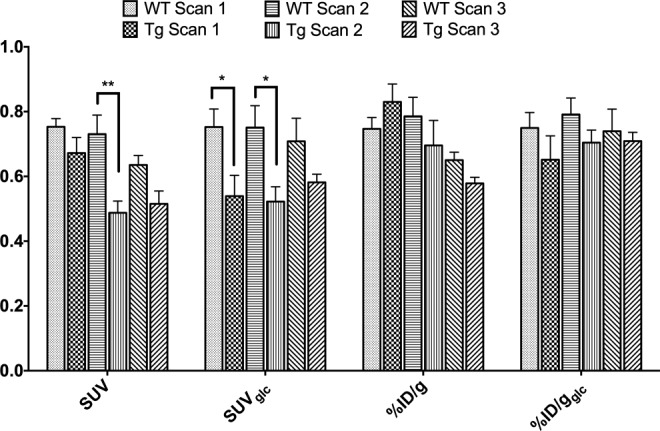
Graph representing the different image quantifications percent injected dose (%ID/g) and standard uptake value (SUV) with and without glucose correction for the thalamus in WT and Tg mice on the different scan days.
Official websites use .gov
A
.gov website belongs to an official
government organization in the United States.
Secure .gov websites use HTTPS
A lock (
) or https:// means you've safely
connected to the .gov website. Share sensitive
information only on official, secure websites.
Graph representing the different image quantifications percent injected dose (%ID/g) and standard uptake value (SUV) with and without glucose correction for the thalamus in WT and Tg mice on the different scan days.