
Figure 1.
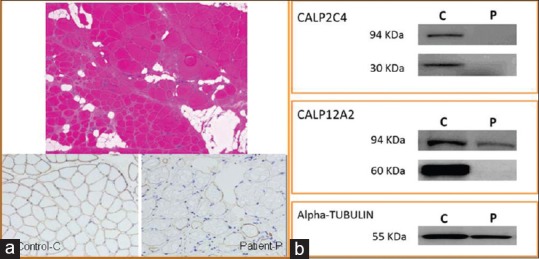
(a) Top: Hematoxylin and eosin staining: Dystrophic pattern. Bottom: DYS-3 antibody: Left, control (c) and right patient (p). The patient shows a loss of expression in some fibers. (b) Western blot: Abnormal calpain-3 protein expression. CALP2C4 antibody: absence of 94 and 30 KDa protein bands in the patient (p) relative to control. (c) CALP-12A2 antibody: No significant differences in the 94KDa protein in the P relative to C, no band observed in the 60KDa protein in P